Fig. 7.
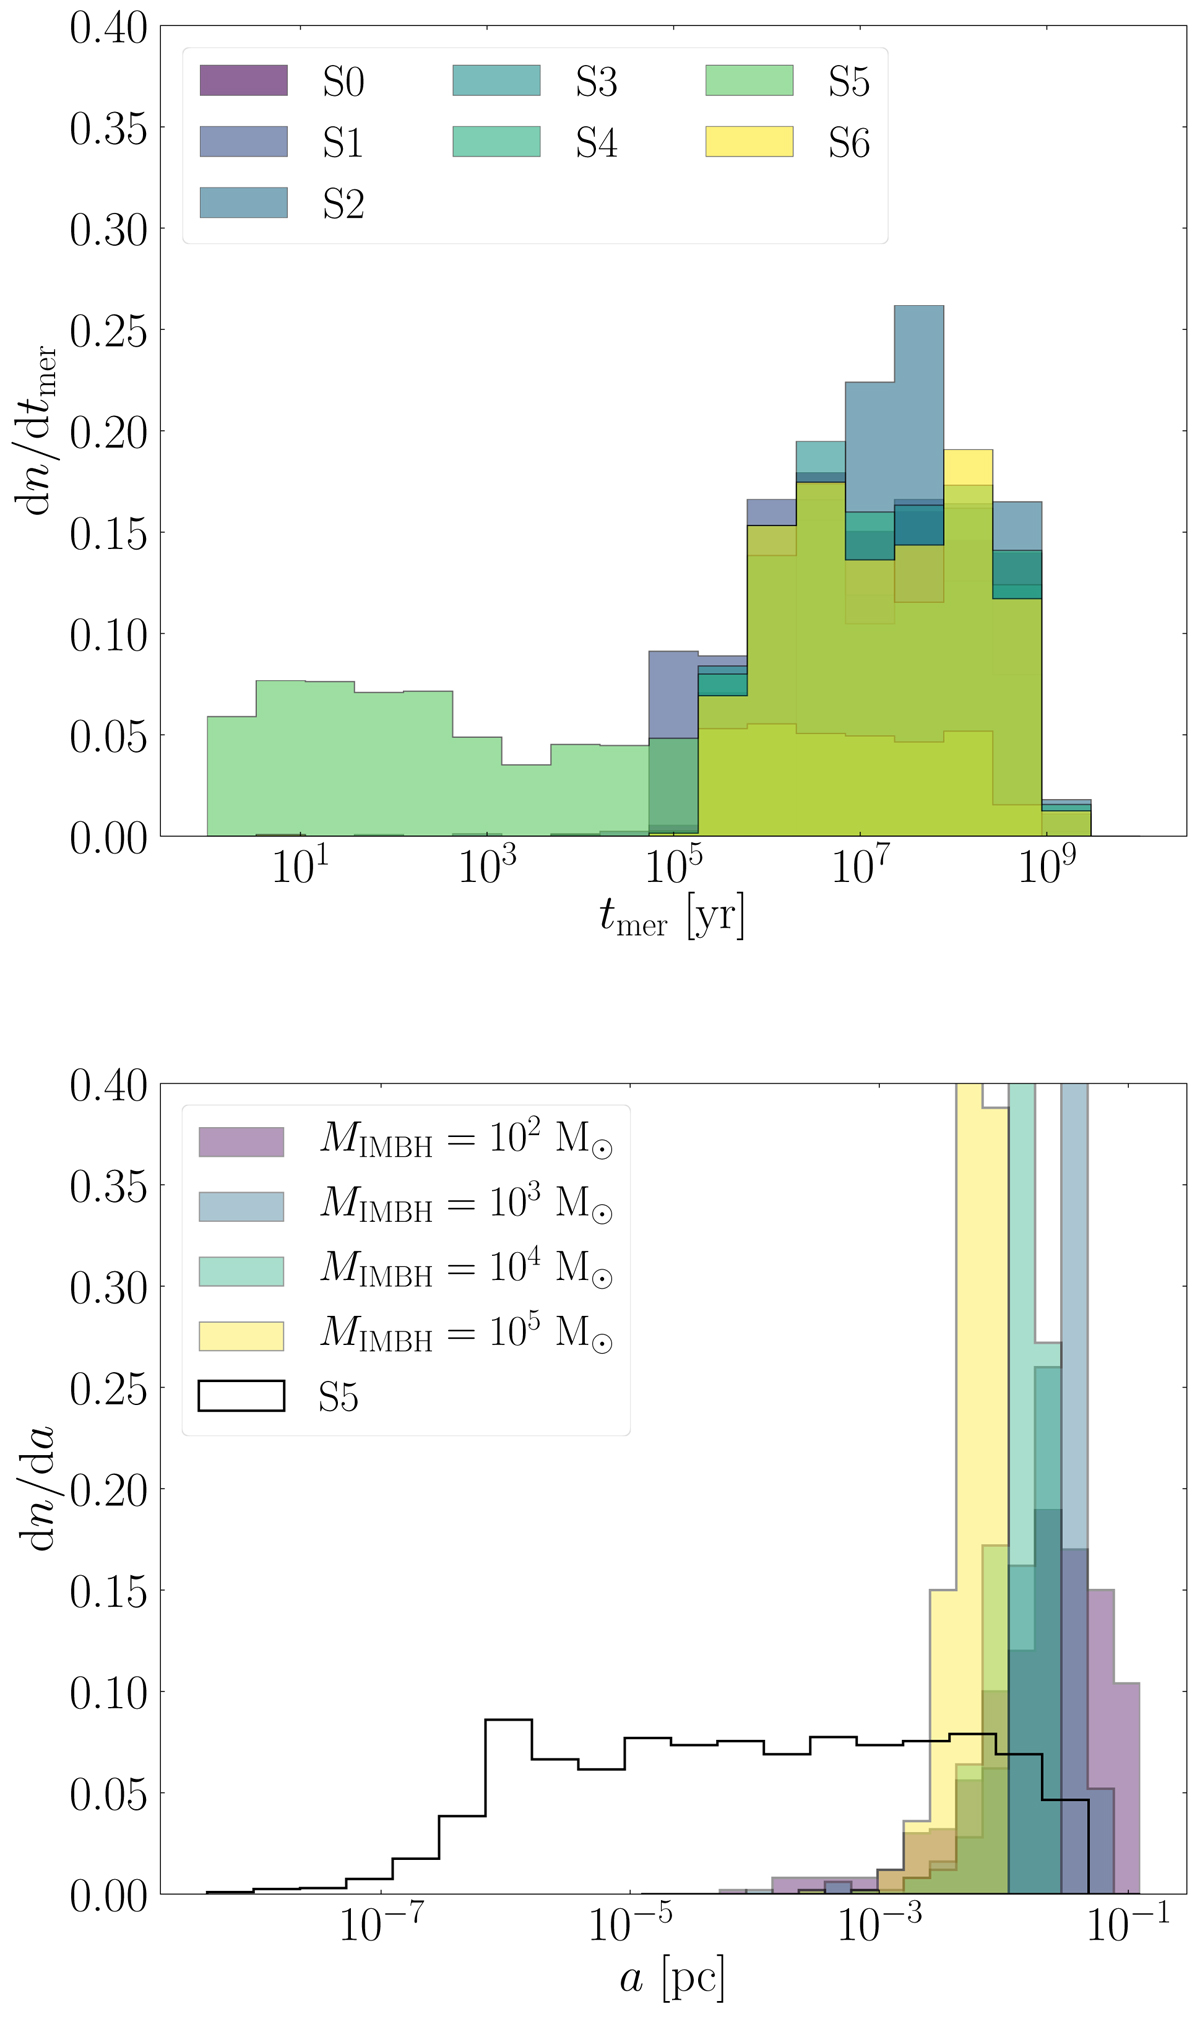
Top panel: distribution of IMRI merging times calculated for all mergers in all the models explored. Different colours and symbols correspond to different model sets as indicated in the legend. Bottom panel: initial semimajor axis distribution in set S5 (black steps) and set S0 (filled steps). For the latter, we show the distribution for different values of the IMBH mass.
Current usage metrics show cumulative count of Article Views (full-text article views including HTML views, PDF and ePub downloads, according to the available data) and Abstracts Views on Vision4Press platform.
Data correspond to usage on the plateform after 2015. The current usage metrics is available 48-96 hours after online publication and is updated daily on week days.
Initial download of the metrics may take a while.