Free Access
Fig. 3.
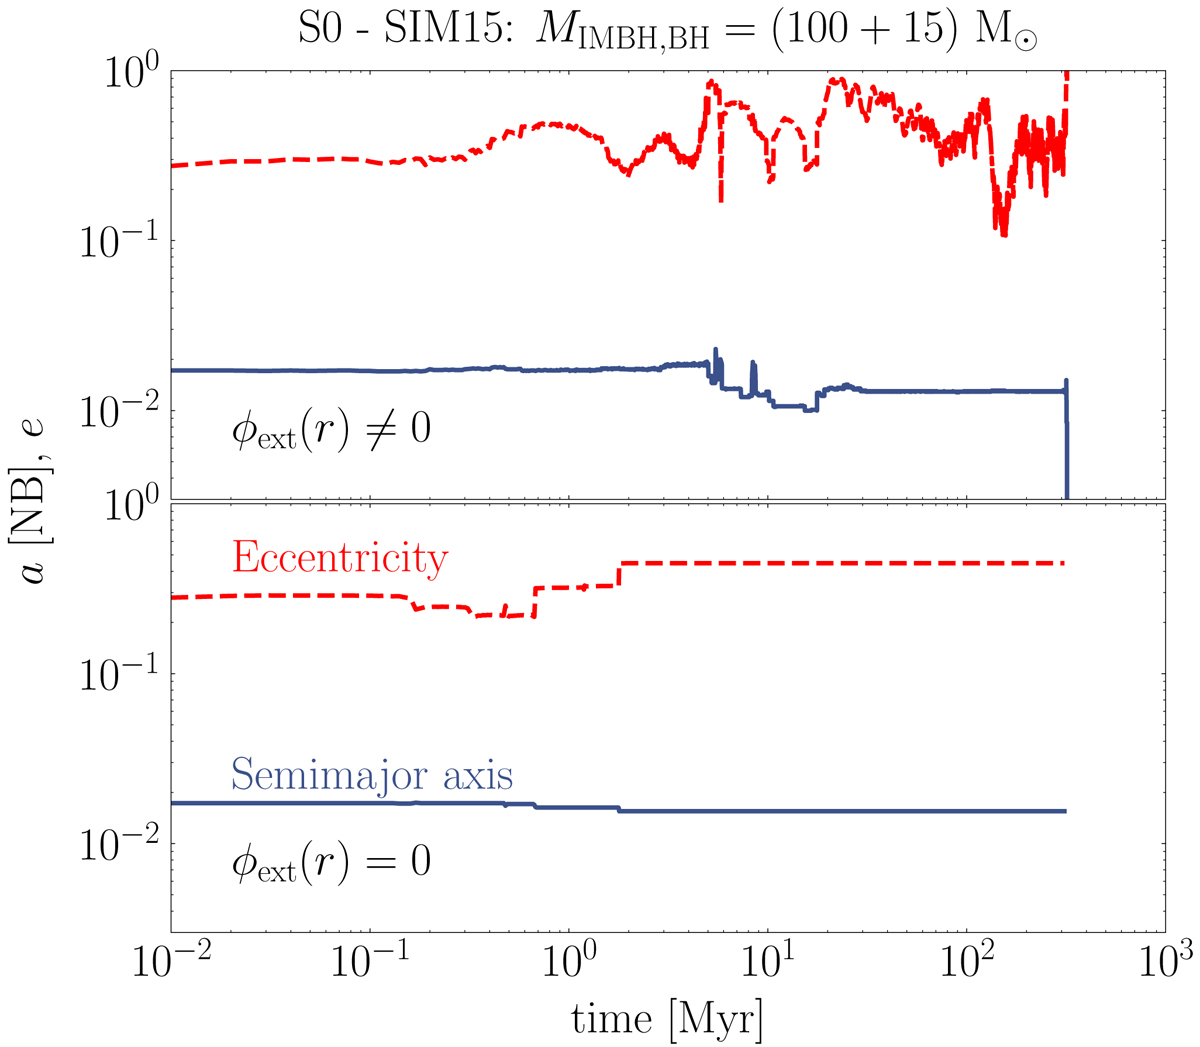
Time-evolution of the semimajor axis (straight blue line) and eccentricity (dotted red line) for one of the simulations performed in S0. Panels show the case with (top panel) and without (bottom panel) the external potential of the cluster.
Current usage metrics show cumulative count of Article Views (full-text article views including HTML views, PDF and ePub downloads, according to the available data) and Abstracts Views on Vision4Press platform.
Data correspond to usage on the plateform after 2015. The current usage metrics is available 48-96 hours after online publication and is updated daily on week days.
Initial download of the metrics may take a while.