Fig. 20.
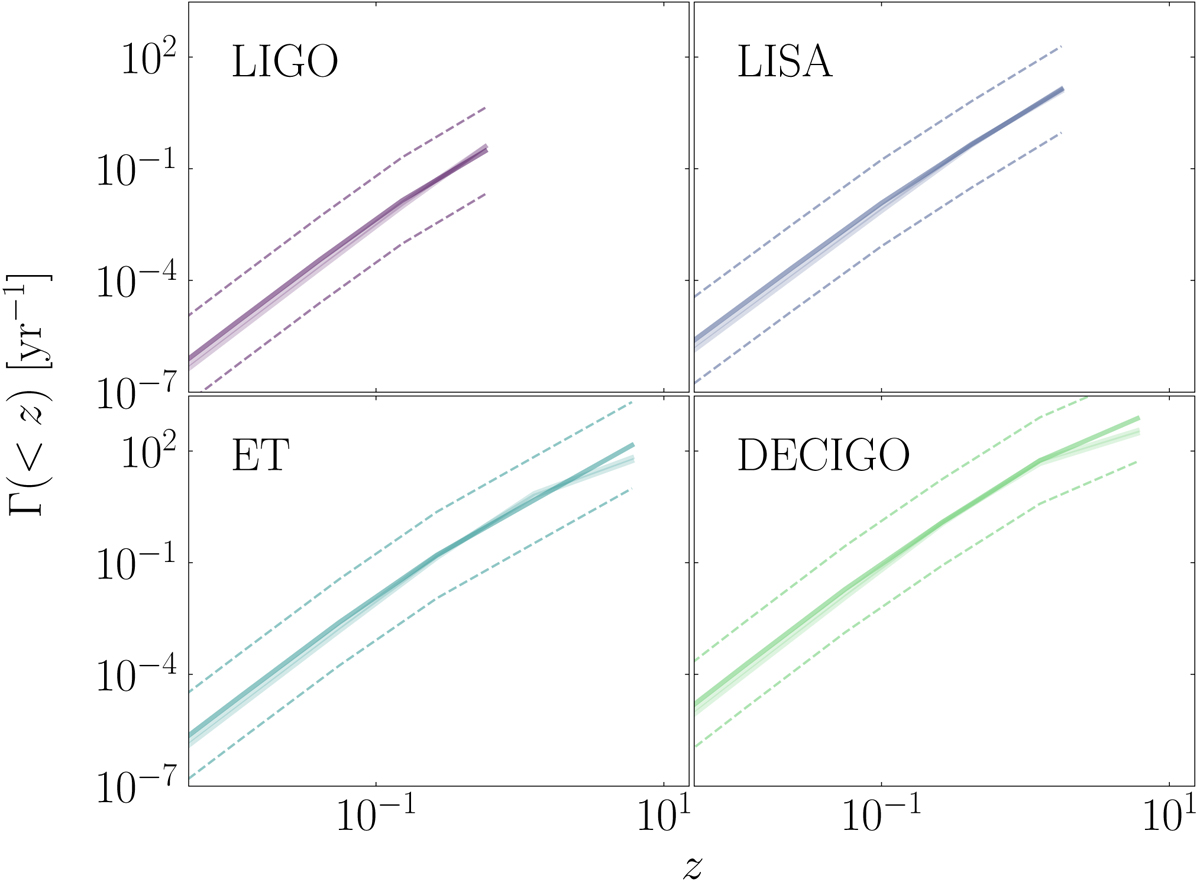
Cumulative merger rate as a function of redshift for different detectors. Thick lines represent the results from GAL model, whereas the thin lines correspond to CFR and CSFE, assuming the mean value of the elapsed time. The dotted lines represent the upper(lower) bounds as determined by the minimum(maximum) value of ⟨T⟩. We assume that the BH companion in the IMRI has a mass MBH = 30 M⊙.
Current usage metrics show cumulative count of Article Views (full-text article views including HTML views, PDF and ePub downloads, according to the available data) and Abstracts Views on Vision4Press platform.
Data correspond to usage on the plateform after 2015. The current usage metrics is available 48-96 hours after online publication and is updated daily on week days.
Initial download of the metrics may take a while.