Fig. 5
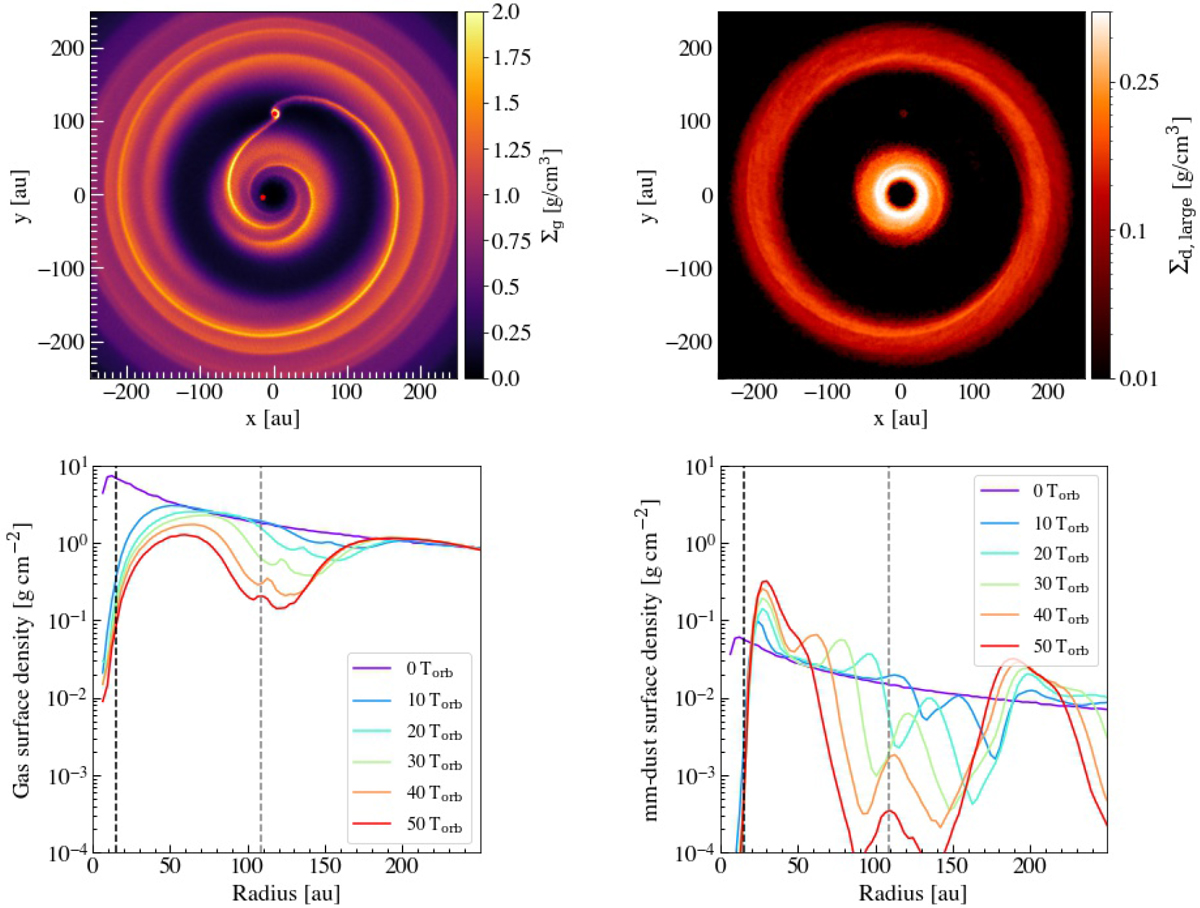
SPH results. Top: surface density of gas and 1 mm dust grains after t = 50 Torb. The positionsof the planets are shown as red dots in the left panel. Bottom: temporal evolution of the azimuthally averaged surface density profiles. The final positions of the two planets are indicated by the vertical dashed lines. The shape of the outer gap, both in gas and in dust, reflect the radial migration of the planet.
Current usage metrics show cumulative count of Article Views (full-text article views including HTML views, PDF and ePub downloads, according to the available data) and Abstracts Views on Vision4Press platform.
Data correspond to usage on the plateform after 2015. The current usage metrics is available 48-96 hours after online publication and is updated daily on week days.
Initial download of the metrics may take a while.