Fig. 2
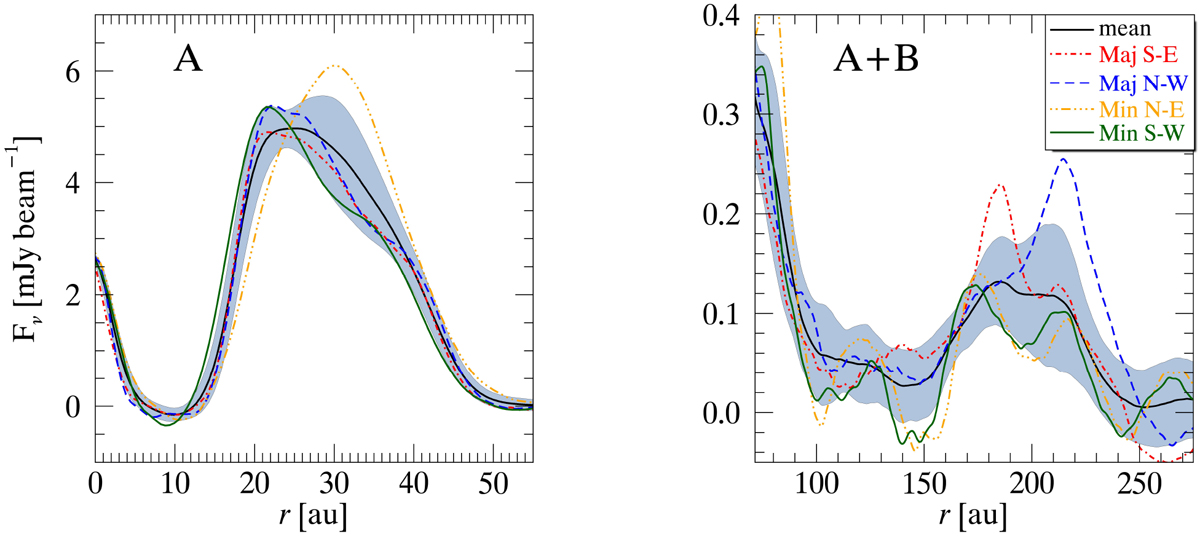
Surface brightness profiles of the inner (left, from data set A) and outer (right, combined data sets A + B) disk of HD 100546. The black curve and the gray region represent the azimuthally averaged profile and standard deviation obtained after de-projecting the images by 42°. The profiles along the semimajor and semiminor axes are overplotted in color; they were obtained by averaging the radial profiles over a range of ±10° around the corresponding axis.
Current usage metrics show cumulative count of Article Views (full-text article views including HTML views, PDF and ePub downloads, according to the available data) and Abstracts Views on Vision4Press platform.
Data correspond to usage on the plateform after 2015. The current usage metrics is available 48-96 hours after online publication and is updated daily on week days.
Initial download of the metrics may take a while.