Free Access
Fig. 1
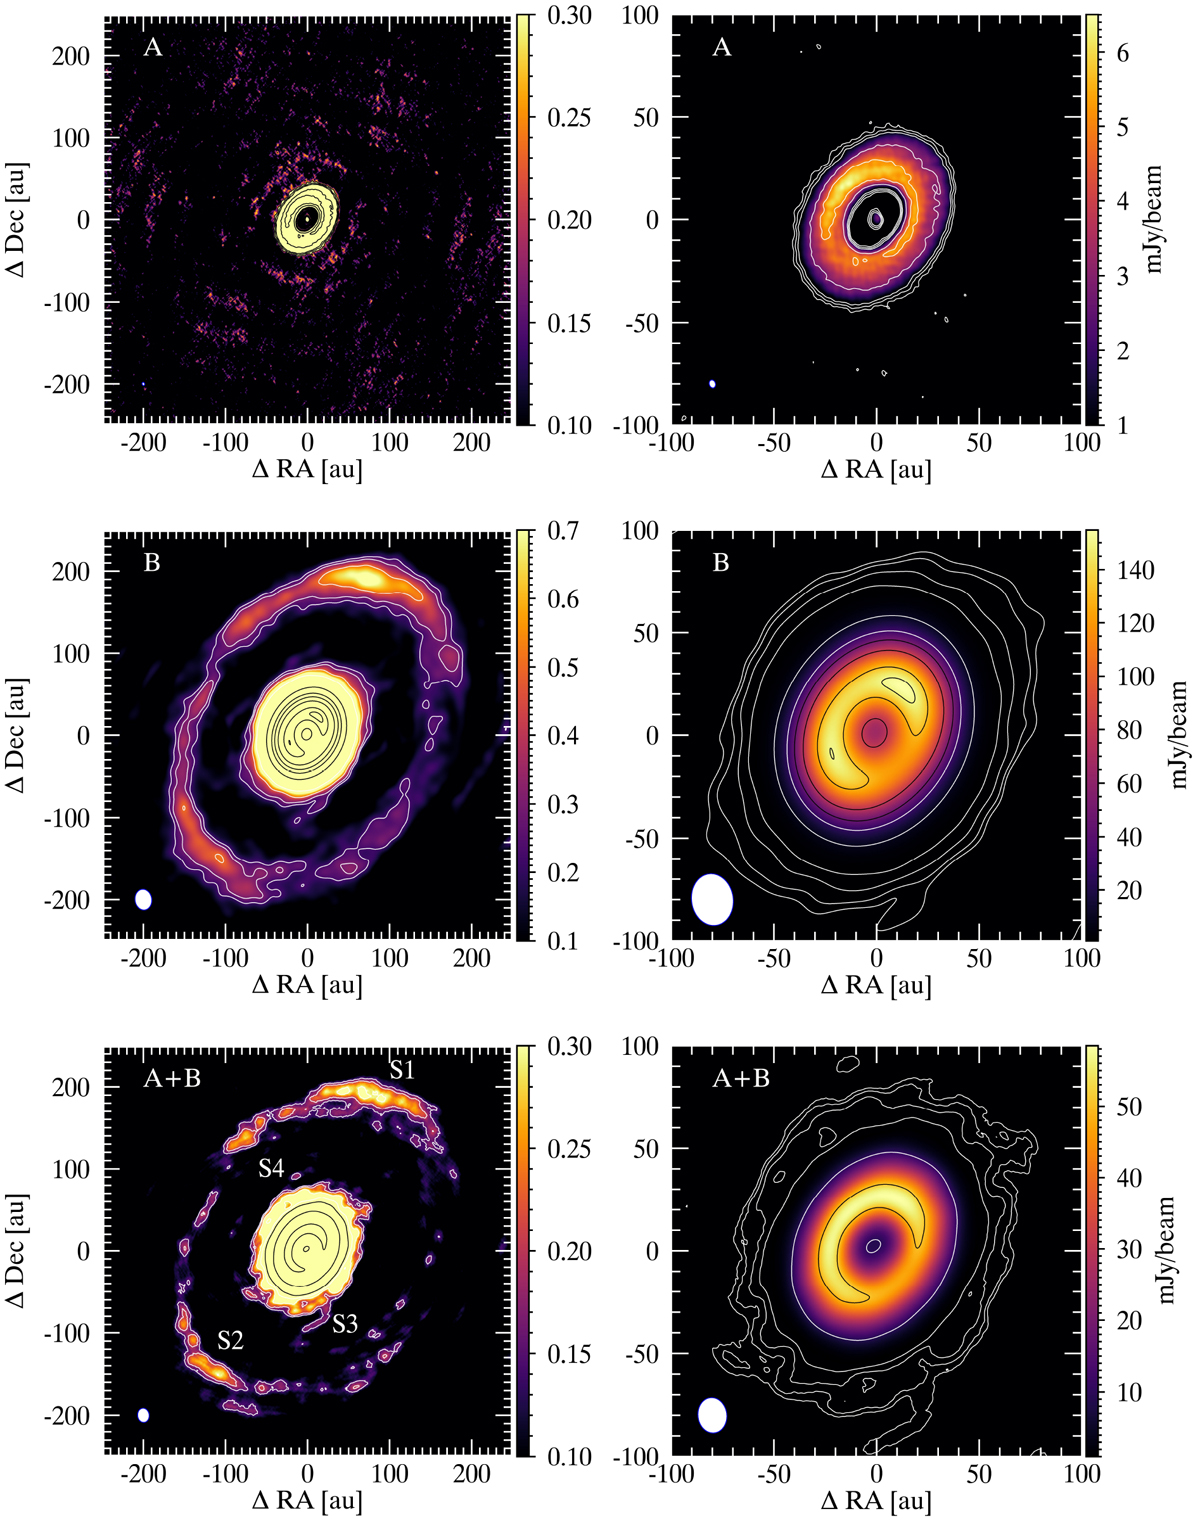
ALMA band 7 continuum observations of HD 100546 from data set A (top), data set B (middle), and from the concatenated set (bottom). The right panels show a zoom into the inner 100 au. The first overlaid contour in the bottom panels corresponds to the 4.5 σ level (0.15 mJy beam−1).
Current usage metrics show cumulative count of Article Views (full-text article views including HTML views, PDF and ePub downloads, according to the available data) and Abstracts Views on Vision4Press platform.
Data correspond to usage on the plateform after 2015. The current usage metrics is available 48-96 hours after online publication and is updated daily on week days.
Initial download of the metrics may take a while.