Fig. 8.
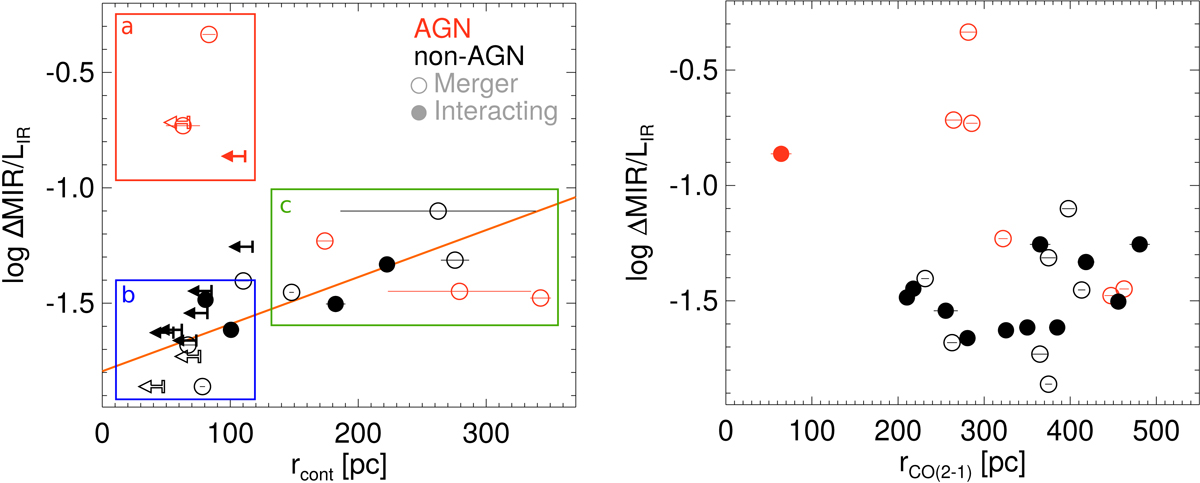
Logarithm of the excess mid-IR emission vs. size of the 220 GHz continuum (left panel) and size of the CO(2–1) emission (right panel). Galaxy symbols are as in Fig. 5. The solid orange line is the best linear fit to the non-AGN (black) points. In the left panel, the red box (a) marks a region of this diagram solely occupied by optically detected AGN. The blue box (b) indicates the location of very compact ULIRG nuclei (mostly unresolved by our data) with negligible excess mid-IR emission. The green box shows the location of more extended nuclei with higher mid-IR excess.
Current usage metrics show cumulative count of Article Views (full-text article views including HTML views, PDF and ePub downloads, according to the available data) and Abstracts Views on Vision4Press platform.
Data correspond to usage on the plateform after 2015. The current usage metrics is available 48-96 hours after online publication and is updated daily on week days.
Initial download of the metrics may take a while.