Fig. 7.
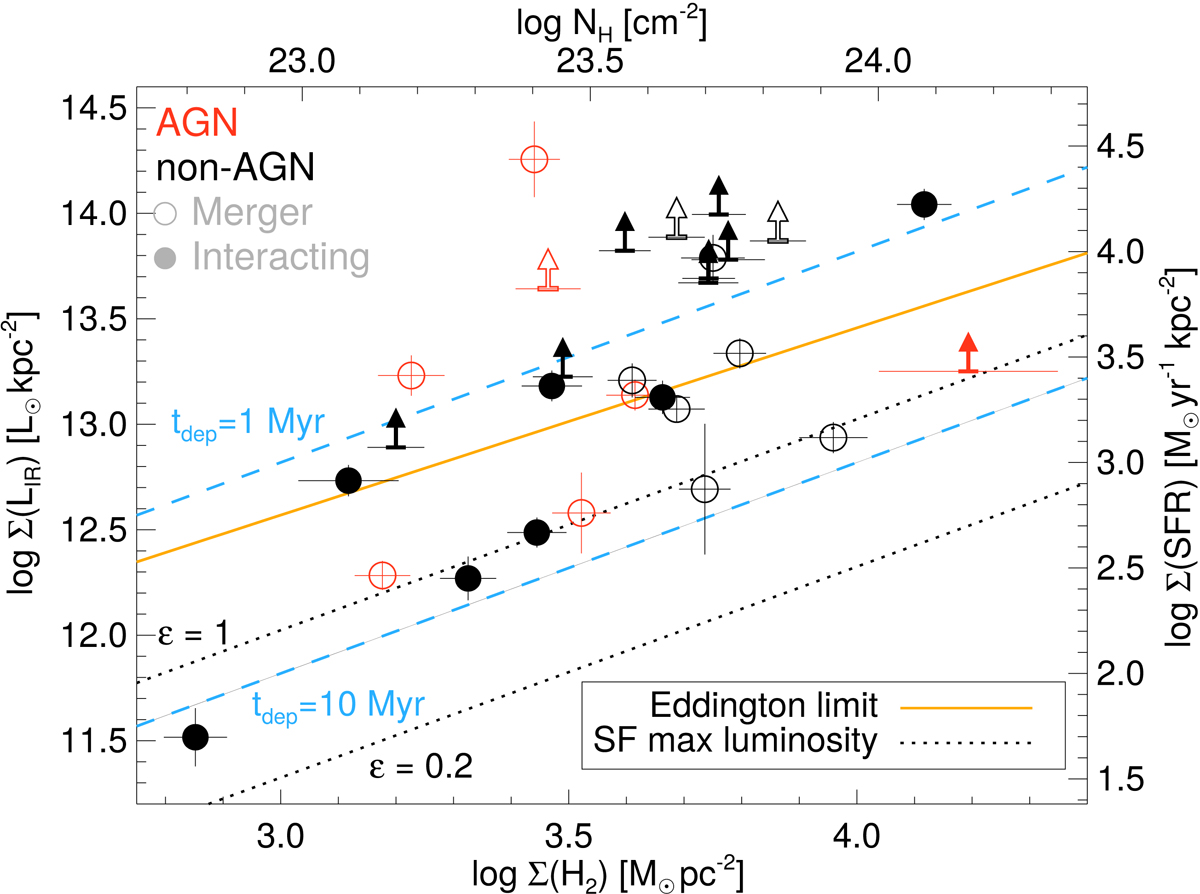
Cold molecular gas surface density (ΣH2) vs. IR luminosity surface density (ΣLIR). Galaxy symbols are as in Fig. 5. The dotted black lines indicate the maximum luminosity from an instantaneous starburst using 100% (ϵ = 1) or 20% (ϵ = 0.2) of the available cold molecular gas (see Sect. 5.2.1). The orange solid line is the Eddington luminosity limit. For points above this line, the radiation pressure is stronger than gravity (Sect. 5.5). The dashed blue lines indicate the 1 and 10 Myr depletion times for reference assuming that the IR luminosity is produced by SF. The column density (NH) axis is calculated from ΣH2 assuming a uniform mass distribution (i.e., NH = 2 × ΣH2/m(H2) where m(H2) is the H2 molecular weight).
Current usage metrics show cumulative count of Article Views (full-text article views including HTML views, PDF and ePub downloads, according to the available data) and Abstracts Views on Vision4Press platform.
Data correspond to usage on the plateform after 2015. The current usage metrics is available 48-96 hours after online publication and is updated daily on week days.
Initial download of the metrics may take a while.