Fig. 6.
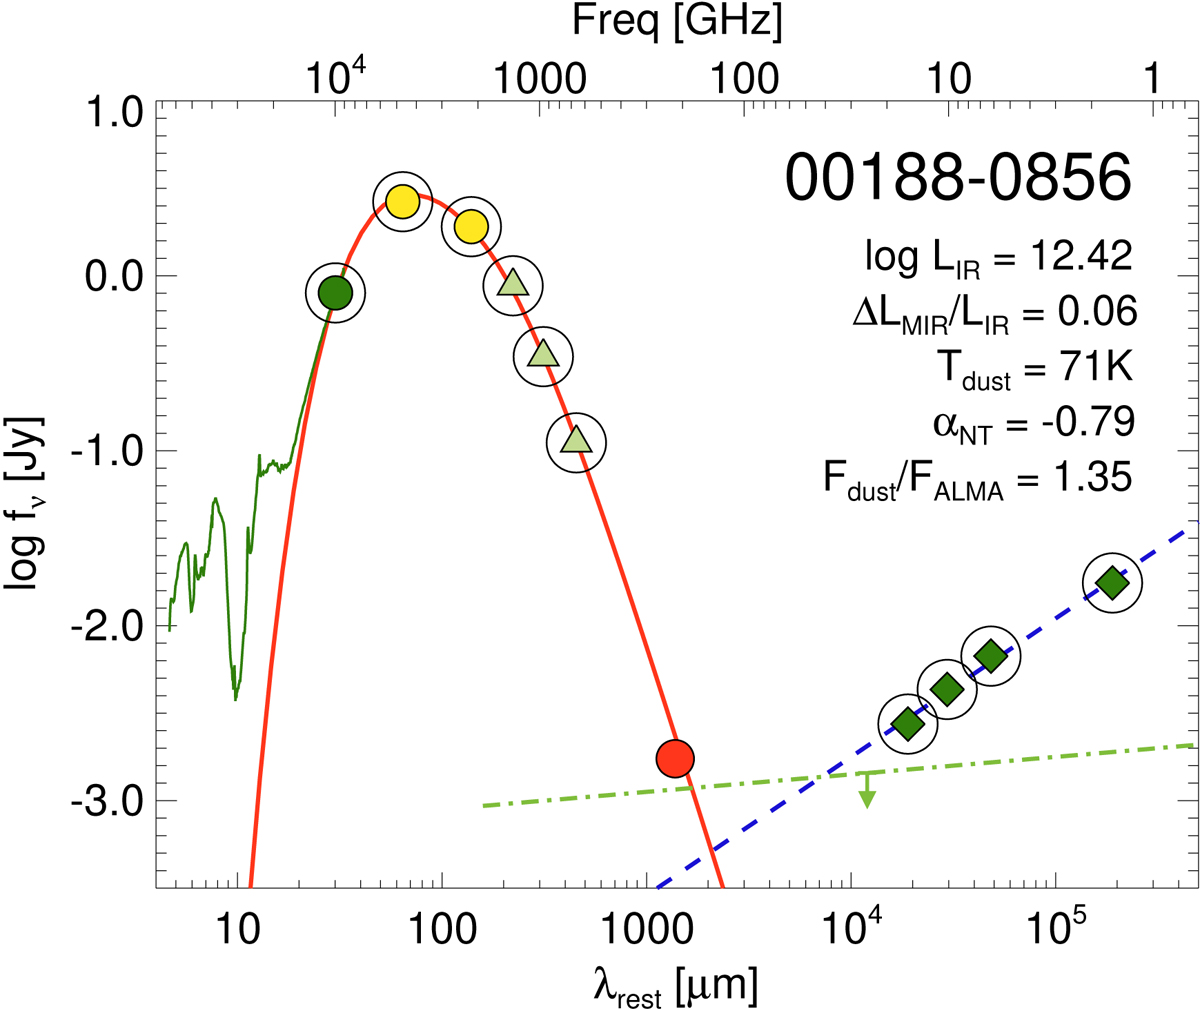
SED fit for 00188−0856 as an example. The data points correspond to the radio (green diamonds), ALMA ∼220 GHz from this paper (red circle), and IR (remaining points) observations. The solid green line is the 5–38 μm Spitzer/IRS spectrum. The IR observations are color coded as follows: Spitzer/IRS synthetic photometry at 34 μm (green circle); Spitzer/MIPS (yellow circles); and Herschel/SPIRE (green triangles). The solid red line is the best gray-body fit and the dashed blue line represents the best power-law fit to the nonthermal radio emission. Only the encircled symbols have been used for the fits (i.e., the ALMA point is excluded from the SED fit). The dot-dashed green line represents the expected maximum free–free emission assuming that all the LIR is produced by SF (see Sect. 4.4). The SED fits for the whole sample are shown in Fig. D.1.
Current usage metrics show cumulative count of Article Views (full-text article views including HTML views, PDF and ePub downloads, according to the available data) and Abstracts Views on Vision4Press platform.
Data correspond to usage on the plateform after 2015. The current usage metrics is available 48-96 hours after online publication and is updated daily on week days.
Initial download of the metrics may take a while.