Fig. 5.
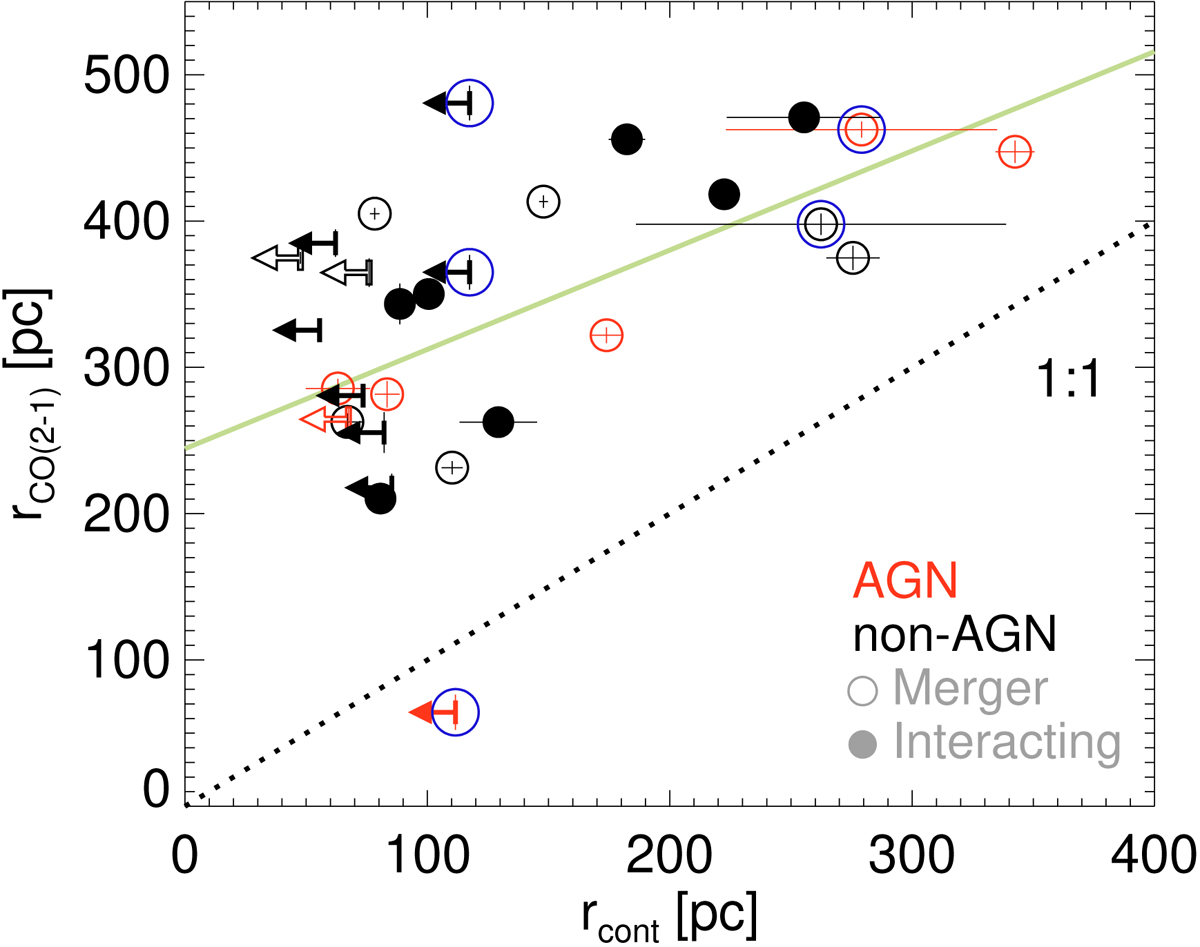
Half light radius of the 220 GHz continuum rcont vs. 0.5 × FWHM of the CO(2–1) emission rCO. Red (black) symbols mark systems classified as AGN (non-AGN) based on optical spectroscopy. Filled symbols correspond to nuclei in interacting systems and empty symbols to nuclei in mergers (see Table 1). Blue encircled symbols are galaxies with excess nonthermal emission whose continuum size estimates might be inaccurate (Sect. 5.1.2). The green line is best linear fit excluding the nuclei with rcont upper limits. The dotted line indicates the 1:1 relation.
Current usage metrics show cumulative count of Article Views (full-text article views including HTML views, PDF and ePub downloads, according to the available data) and Abstracts Views on Vision4Press platform.
Data correspond to usage on the plateform after 2015. The current usage metrics is available 48-96 hours after online publication and is updated daily on week days.
Initial download of the metrics may take a while.