Fig. 4.
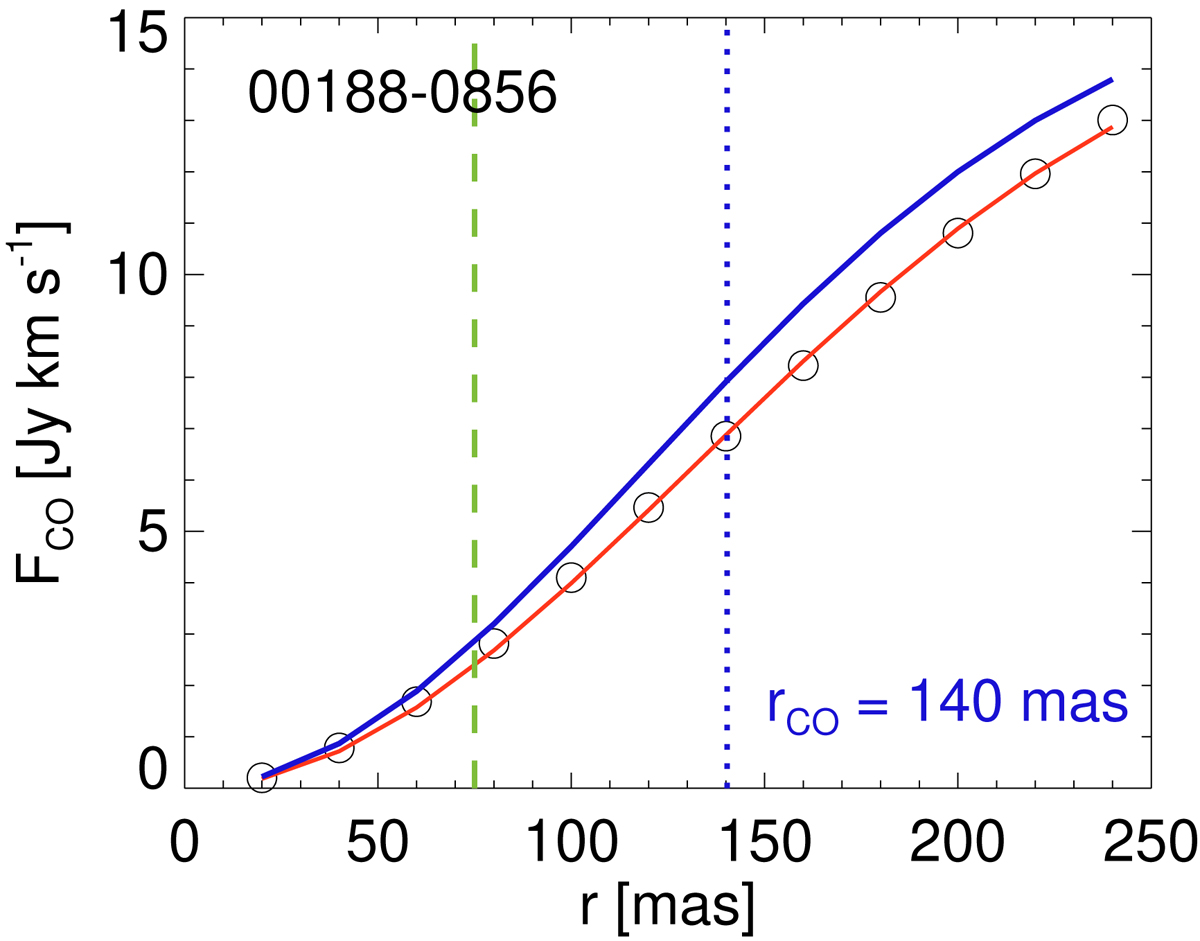
Growth curve of the CO(2–1) moment 0 map for 00188−0856 as an example. The circles correspond to the observed flux within a circular aperture of radius r. The red line is the best fit model (Sect. 4.3). The deconvolved best fit profile is shown in blue and its effective radius, rCO = FWHM/2, is indicated by the vertical blue dotted line. The dashsed green line marks the ∼220 GHz continuum radius, rcont for comparison. The CO(2–1) model fits for the whole sample are shown in Fig. C.1.
Current usage metrics show cumulative count of Article Views (full-text article views including HTML views, PDF and ePub downloads, according to the available data) and Abstracts Views on Vision4Press platform.
Data correspond to usage on the plateform after 2015. The current usage metrics is available 48-96 hours after online publication and is updated daily on week days.
Initial download of the metrics may take a while.