Fig. 3.
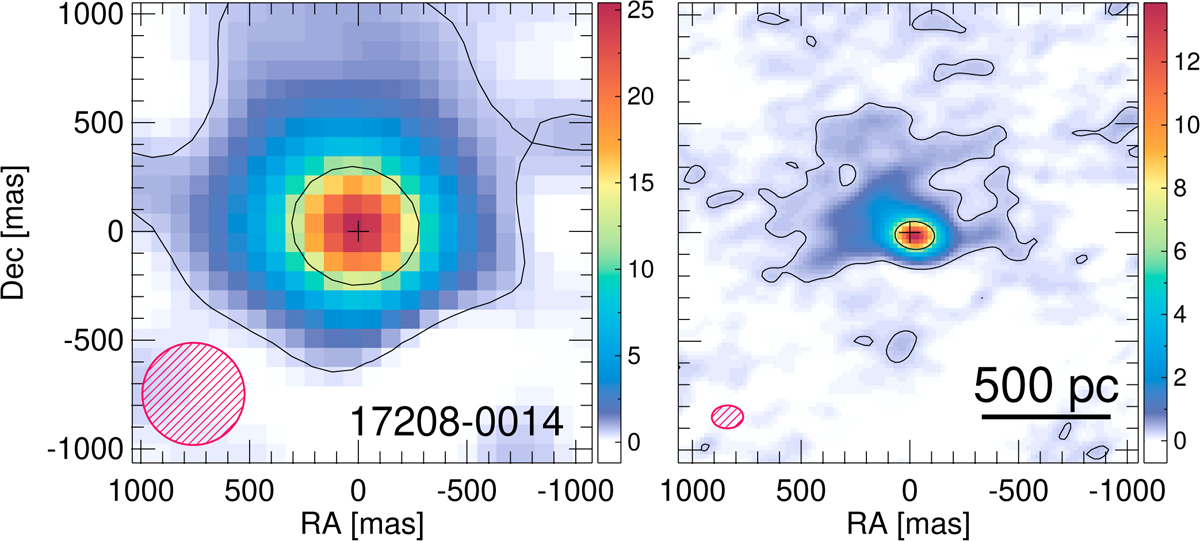
Comparison between the 400 pc resolution 247 GHz continuum image analyzed in Sect. 4.1 (left panel) and the higher resolution (120 pc) data (right panel) available for 17208−0014. The black cross is the position of the center measured on the 400 pc image. The contours are as in Fig. 1. The hatched red ellipses correspond to the beam FWHM of each image. The color scales are in mJy beam−1.
Current usage metrics show cumulative count of Article Views (full-text article views including HTML views, PDF and ePub downloads, according to the available data) and Abstracts Views on Vision4Press platform.
Data correspond to usage on the plateform after 2015. The current usage metrics is available 48-96 hours after online publication and is updated daily on week days.
Initial download of the metrics may take a while.