Fig. 2.
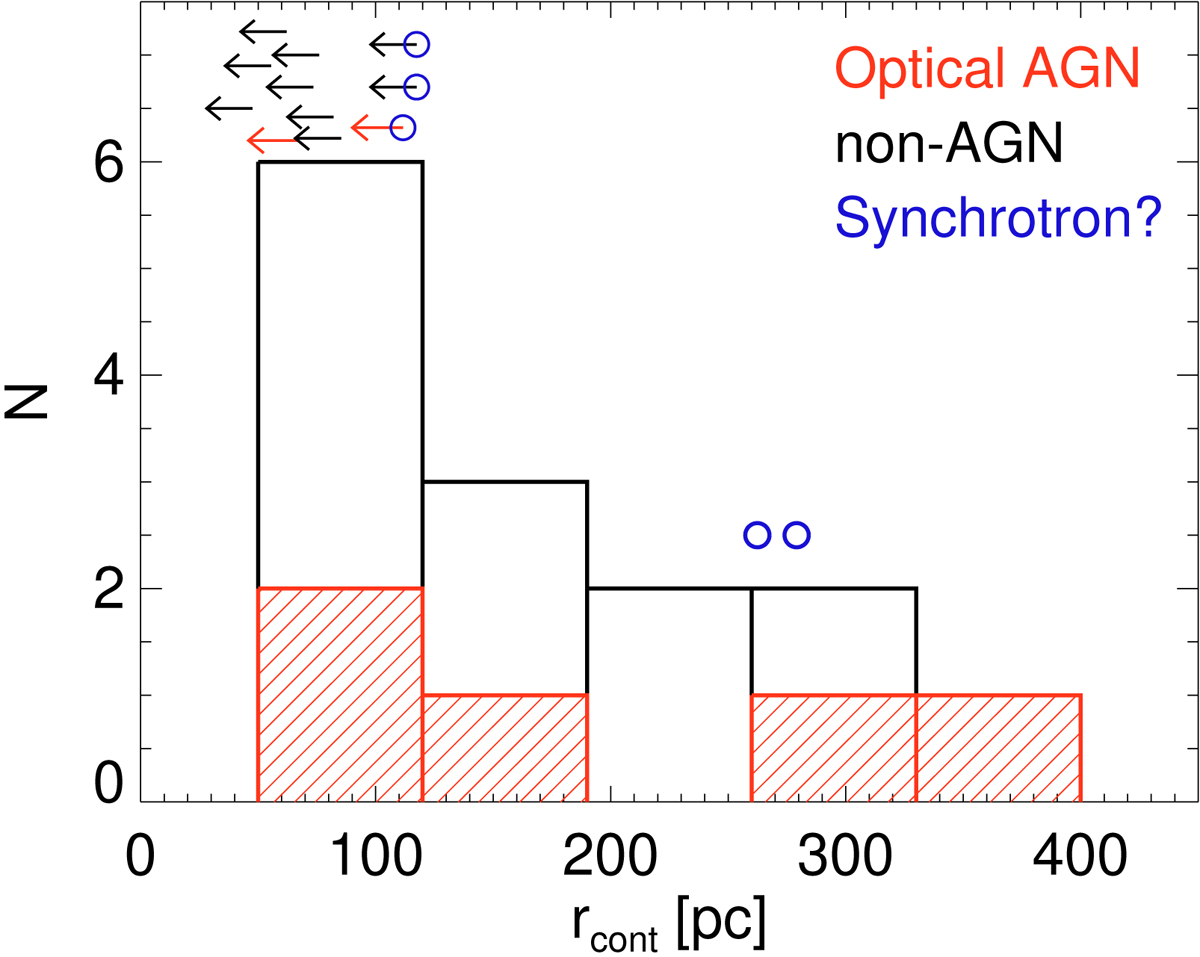
Distribution of the ∼220 GHz continuum half-light radius (rcont; see Table 3). Upper limits are indicated with arrows. The red (black) histogram bars and arrows correspond to galaxies classified as AGN (non-AGN) from optical spectroscopy. The sizes of the systems whose ALMA flux might have high (>40%) nonthermal synchrotron contributions are marked in blue (see Sect. 5.1.2).
Current usage metrics show cumulative count of Article Views (full-text article views including HTML views, PDF and ePub downloads, according to the available data) and Abstracts Views on Vision4Press platform.
Data correspond to usage on the plateform after 2015. The current usage metrics is available 48-96 hours after online publication and is updated daily on week days.
Initial download of the metrics may take a while.