Fig. 11.
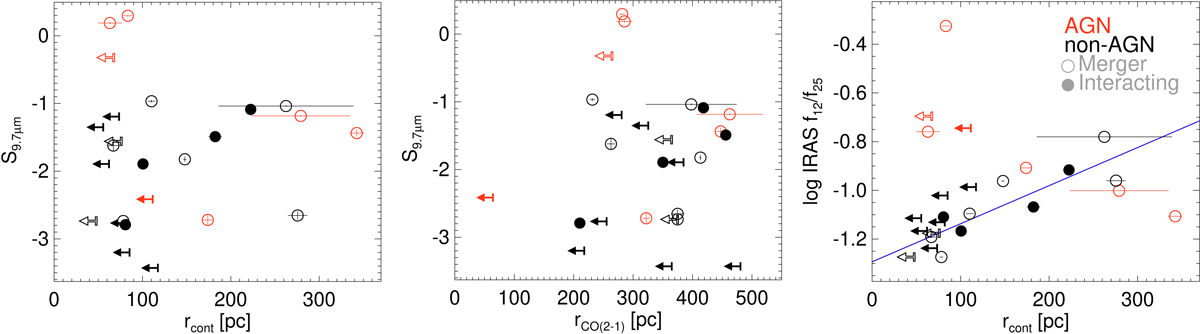
Relation between the 9.7 μm silicate absorption and the 220 GHz continuum (left) and the CO(2–1) (middle) sizes. Right panel: 220 GHz continuum size vs. IRAS 12 μm/25 μm color relation. Symbols as in Fig. 5. For the IRAS 12 μm/25 μm color relation (right), the best linear fit to the non-AGN objects (black symbols) is log f12/f25 = (− 1.29 ± 0.04)+(1.6 ± 0.3)×10−3 × rcont/pc.
Current usage metrics show cumulative count of Article Views (full-text article views including HTML views, PDF and ePub downloads, according to the available data) and Abstracts Views on Vision4Press platform.
Data correspond to usage on the plateform after 2015. The current usage metrics is available 48-96 hours after online publication and is updated daily on week days.
Initial download of the metrics may take a while.