Free Access
Fig. 10.
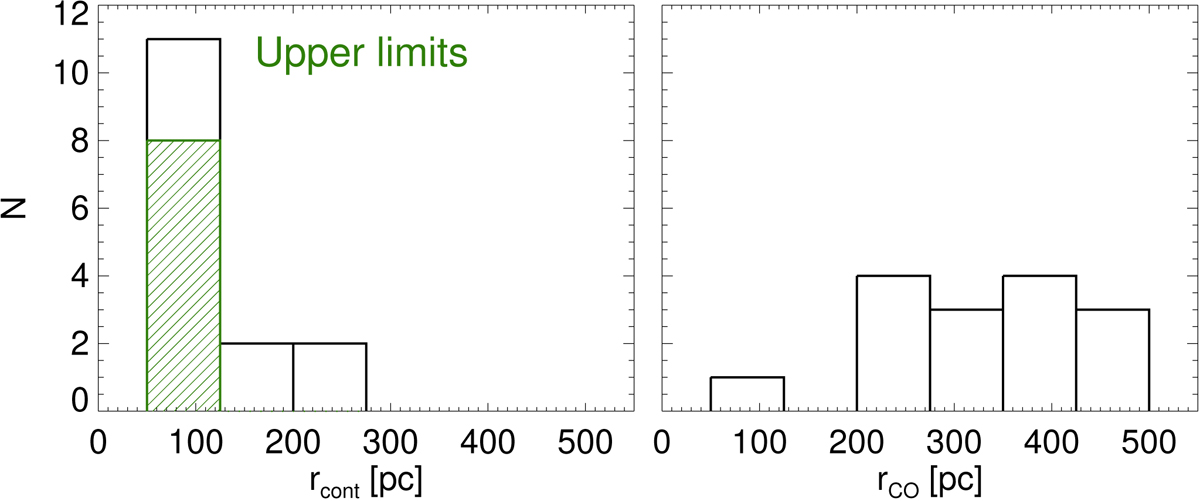
Distribution of the 220 GHz continuum radius rcont (left) and the CO(2–1) emission radius rCO (right) for the nuclei in interacting ULIRGs. The upper limits for the 220 GHz continuum are included in the first bin and indicated by the green shaded area.
Current usage metrics show cumulative count of Article Views (full-text article views including HTML views, PDF and ePub downloads, according to the available data) and Abstracts Views on Vision4Press platform.
Data correspond to usage on the plateform after 2015. The current usage metrics is available 48-96 hours after online publication and is updated daily on week days.
Initial download of the metrics may take a while.