Fig. 1.
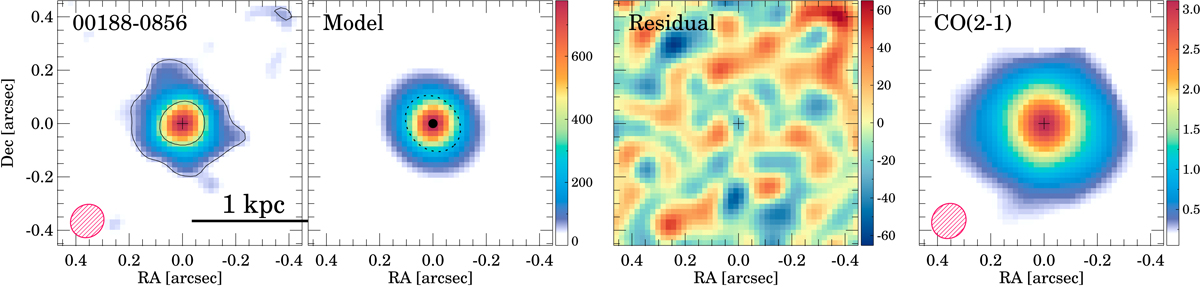
ALMA continuum observation (first panel), best-fit model (second panel), residual emission after subtracting the continuum model (third panel), and the integrated CO(2–1) emission (moment 0) from Lamperti et al., in prep. (fourth panel) for 00188−0856 as an example. The two contour levels in the first panel indicate the 3σ and the 0.5×peak emission levels. In the second panel, the individual components of the best-fit model are presented as a black circle (point source model) and as a dashed ellipse (deconvolved Gaussian model). The black crosses in the first, third, and fourth panels mark the fit location of the continuum peak. The red hatched ellipses represent the beam FWHM. The units are μJy beam−1 for the continuum panels and Jy km s−1 beam−1 for the CO(2–1) panel. The continuum model fits for the whole sample are shown in Fig. B.1.
Current usage metrics show cumulative count of Article Views (full-text article views including HTML views, PDF and ePub downloads, according to the available data) and Abstracts Views on Vision4Press platform.
Data correspond to usage on the plateform after 2015. The current usage metrics is available 48-96 hours after online publication and is updated daily on week days.
Initial download of the metrics may take a while.