Fig. 2.
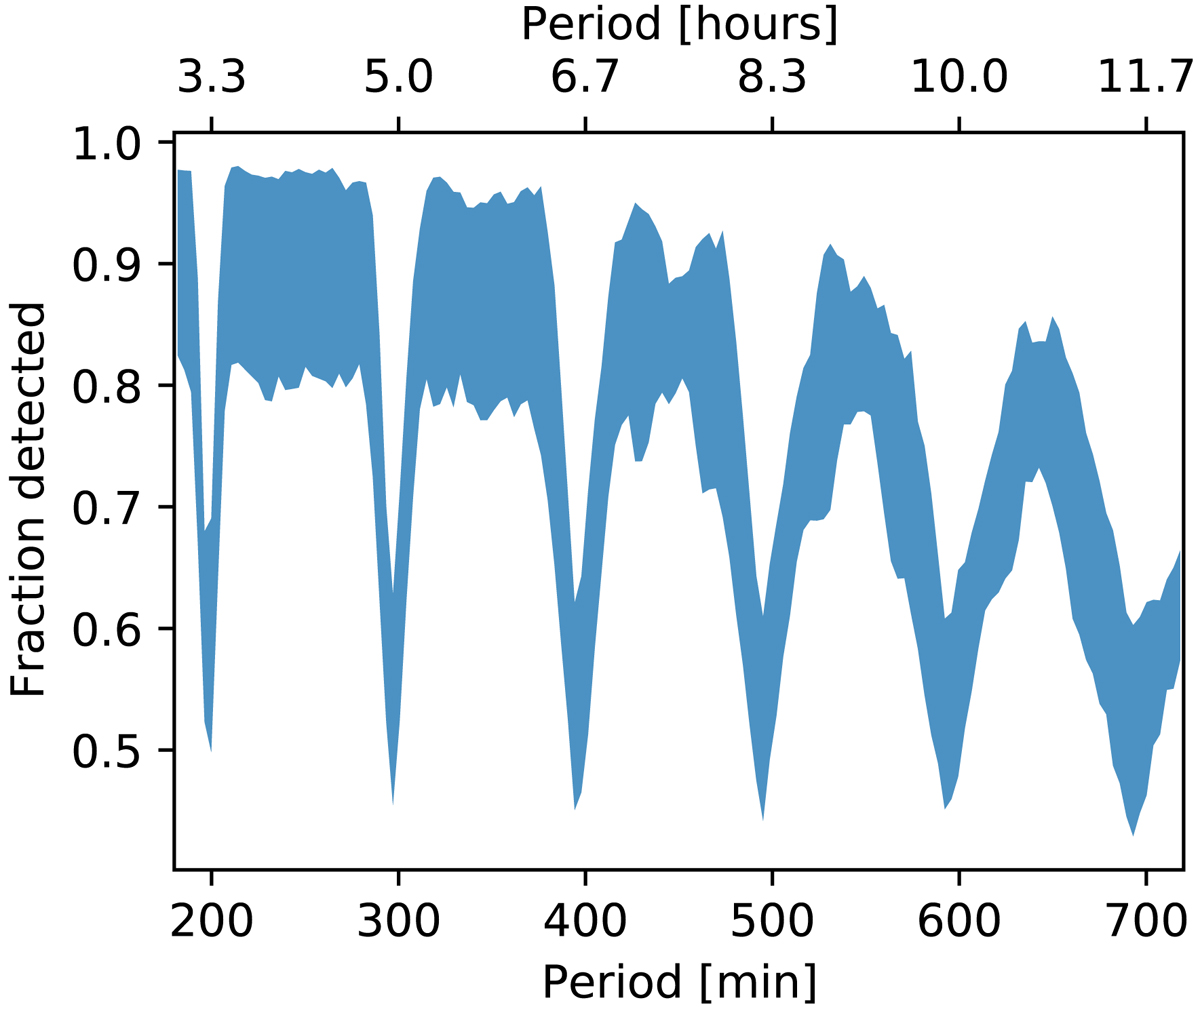
Fraction of detected, simulated and injected transiting objects as a function of their orbital period. Aliases of the 100 min orbital period of CHEOPS are visible as drops in detection efficiency near integer multiples of 100 min. The upper limit of the shaded region represents the fraction of objects detected for the brightest white dwarf in the sample, and the lower limit marks the detection fraction for the faintest white dwarf.
Current usage metrics show cumulative count of Article Views (full-text article views including HTML views, PDF and ePub downloads, according to the available data) and Abstracts Views on Vision4Press platform.
Data correspond to usage on the plateform after 2015. The current usage metrics is available 48-96 hours after online publication and is updated daily on week days.
Initial download of the metrics may take a while.