Fig. 1.
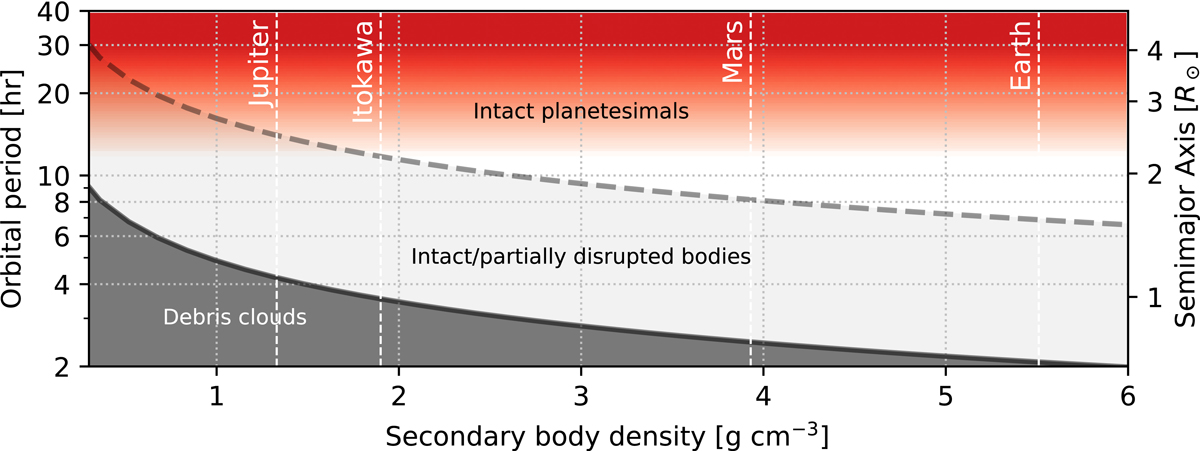
Tidal disruption limits in period-density space for circular orbits (Veras et al. 2014). Vertical dashed lines mark the densities of several secondary bodies spanning a factor of five in bulk density from gas giant planets and rubble-pile asteroids through dense rocky bodies. Red regions of the plot represent regions where only single transit events may be detected in the CHEOPS photometry, nonred regions indicate where several occultations are possible within 24 h of photometry. The curves denote the regions where intact bodies may reside, the middle region marks potentially disrupted bodies, and black denotes bodies that we expect to be tidally disrupted.
Current usage metrics show cumulative count of Article Views (full-text article views including HTML views, PDF and ePub downloads, according to the available data) and Abstracts Views on Vision4Press platform.
Data correspond to usage on the plateform after 2015. The current usage metrics is available 48-96 hours after online publication and is updated daily on week days.
Initial download of the metrics may take a while.