Fig. C.1.
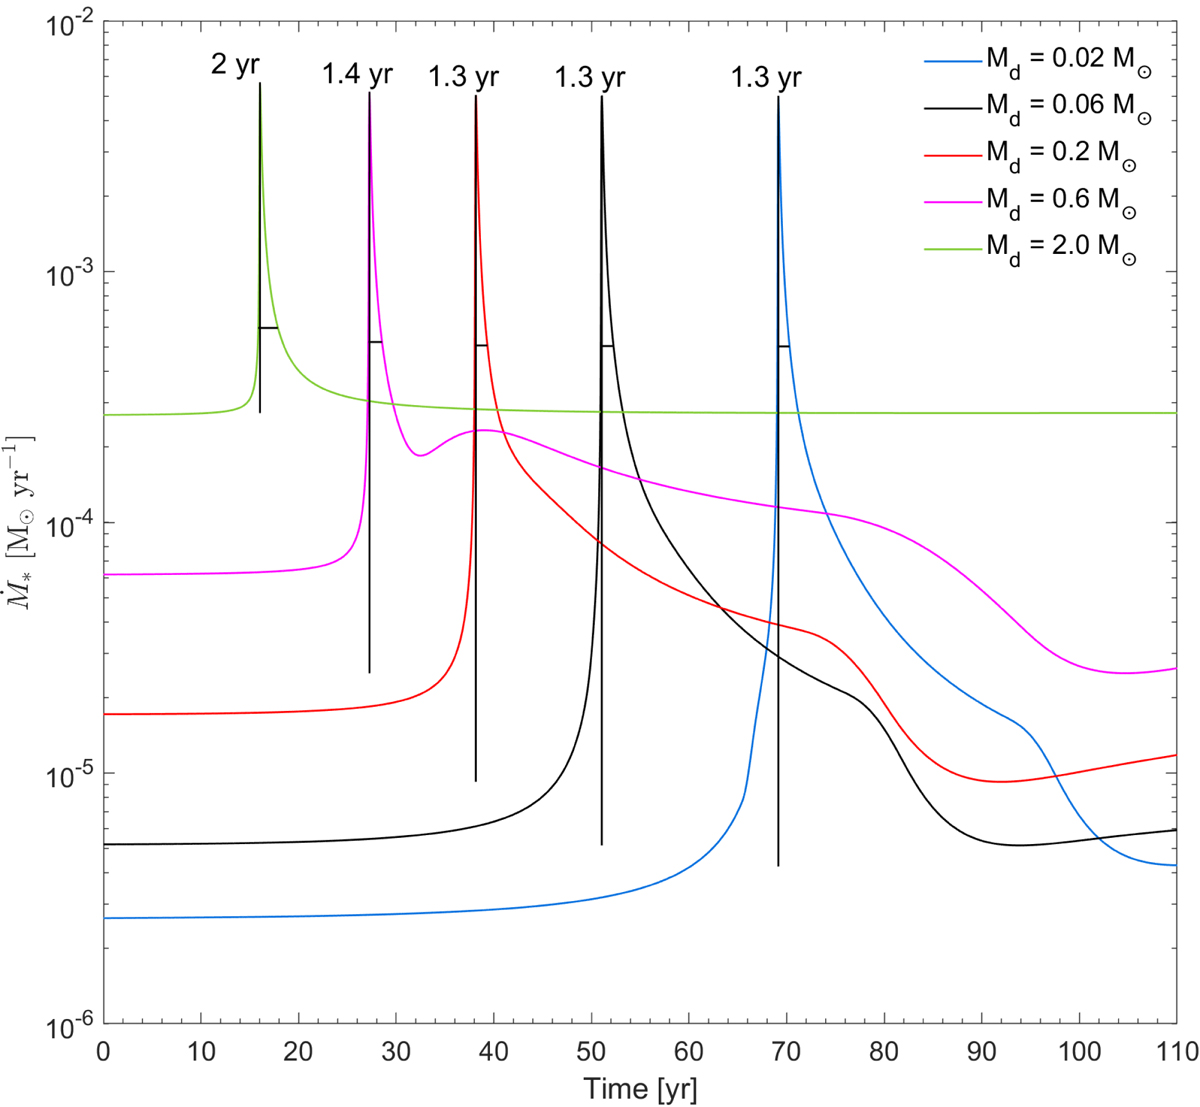
Accretion rate history during a PD burst in five models with different disc masses but with the same planet mass. Vertical black lines show the prominence of each burst, and the horizontal black lines indicate the duration of each burst measured at a vertical distance equal to 10% of the burst prominence. The duration of the burst in years is shown at the top of each burst.
Current usage metrics show cumulative count of Article Views (full-text article views including HTML views, PDF and ePub downloads, according to the available data) and Abstracts Views on Vision4Press platform.
Data correspond to usage on the plateform after 2015. The current usage metrics is available 48-96 hours after online publication and is updated daily on week days.
Initial download of the metrics may take a while.