Fig. 2.
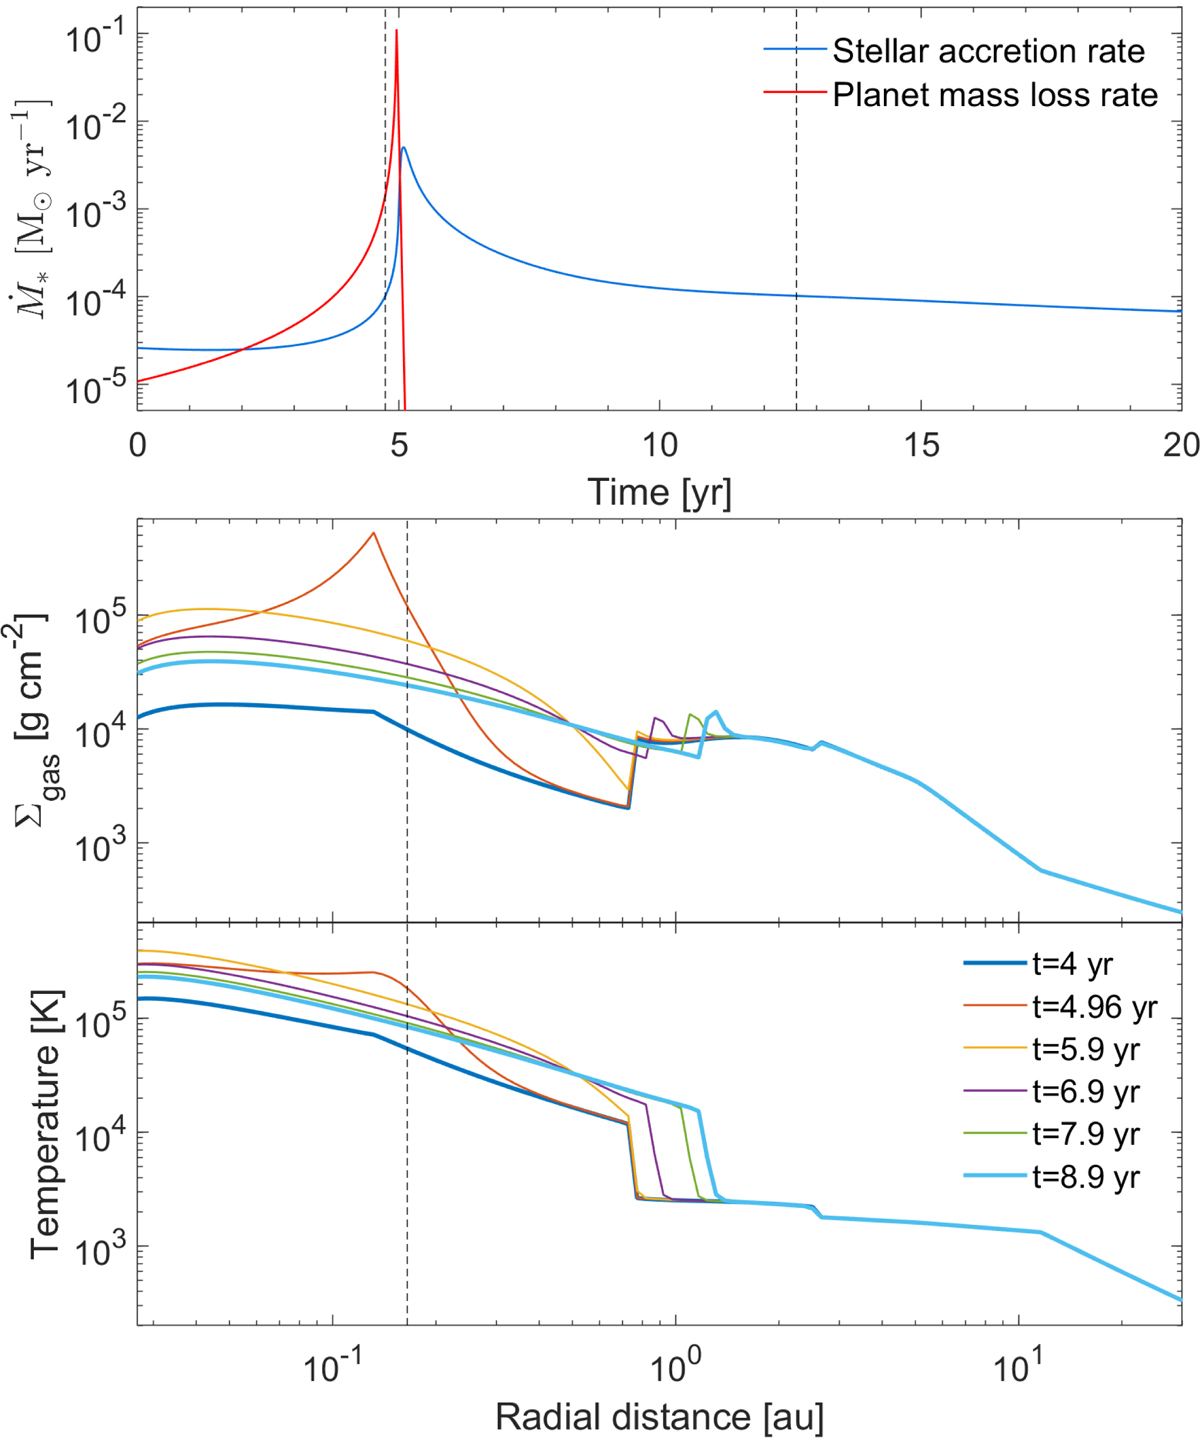
Accretion rate history and disc radial profiles in the PD model. Top: stellar mass accretion rate history (blue line) during a short evolutionary time period when the planet is disrupted and the accretion burst is initiated. The red line shows the rate of mass loss by the planet. Vertical dashed lines mark the beginning and end of the burst. Middle and bottom: temporal evolution of the surface density and temperature distribution during the burst. The vertical dashed line shows the position of the planet at the moment of disruption.
Current usage metrics show cumulative count of Article Views (full-text article views including HTML views, PDF and ePub downloads, according to the available data) and Abstracts Views on Vision4Press platform.
Data correspond to usage on the plateform after 2015. The current usage metrics is available 48-96 hours after online publication and is updated daily on week days.
Initial download of the metrics may take a while.