Fig. 1.
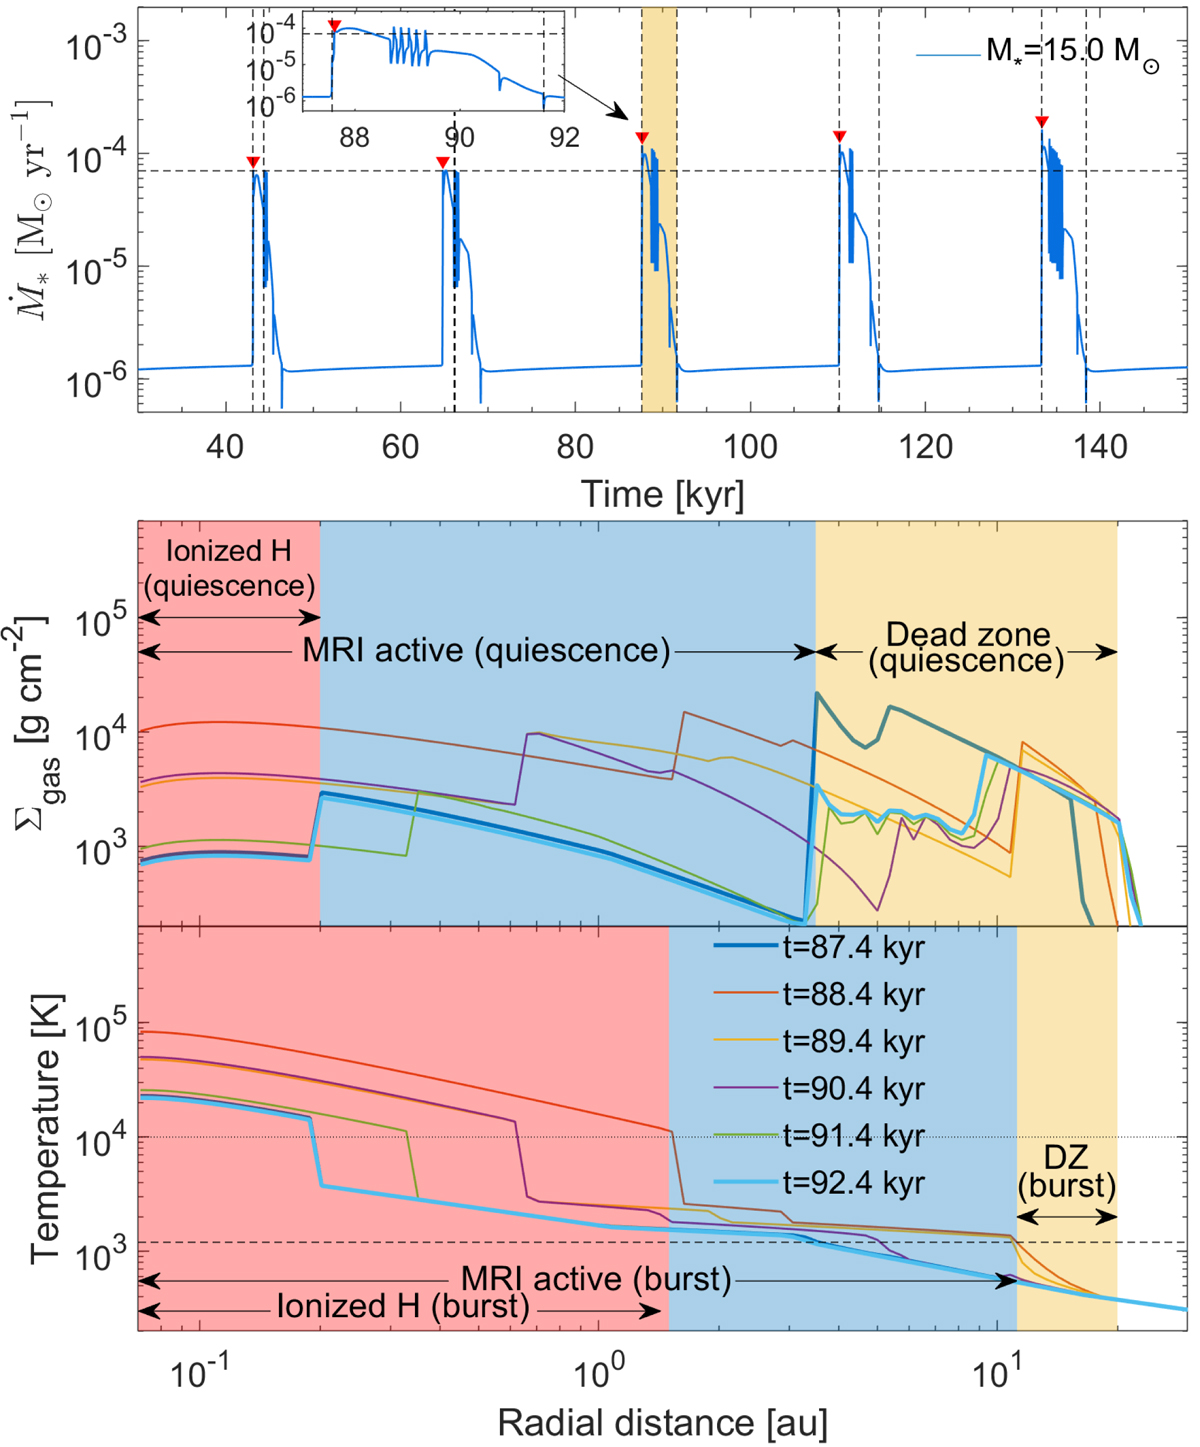
Accretion rate history and disc radial profiles in the MRI model. Top: mass accretion rate as a function of time in the MRI model. The burst highlighted in yellow is also shown in the inset, zoomed in, as well as in the central and bottom panels. Middle and bottom: temporal evolution of the radial distribution of surface density and temperature during the burst.
Current usage metrics show cumulative count of Article Views (full-text article views including HTML views, PDF and ePub downloads, according to the available data) and Abstracts Views on Vision4Press platform.
Data correspond to usage on the plateform after 2015. The current usage metrics is available 48-96 hours after online publication and is updated daily on week days.
Initial download of the metrics may take a while.