Fig. 9
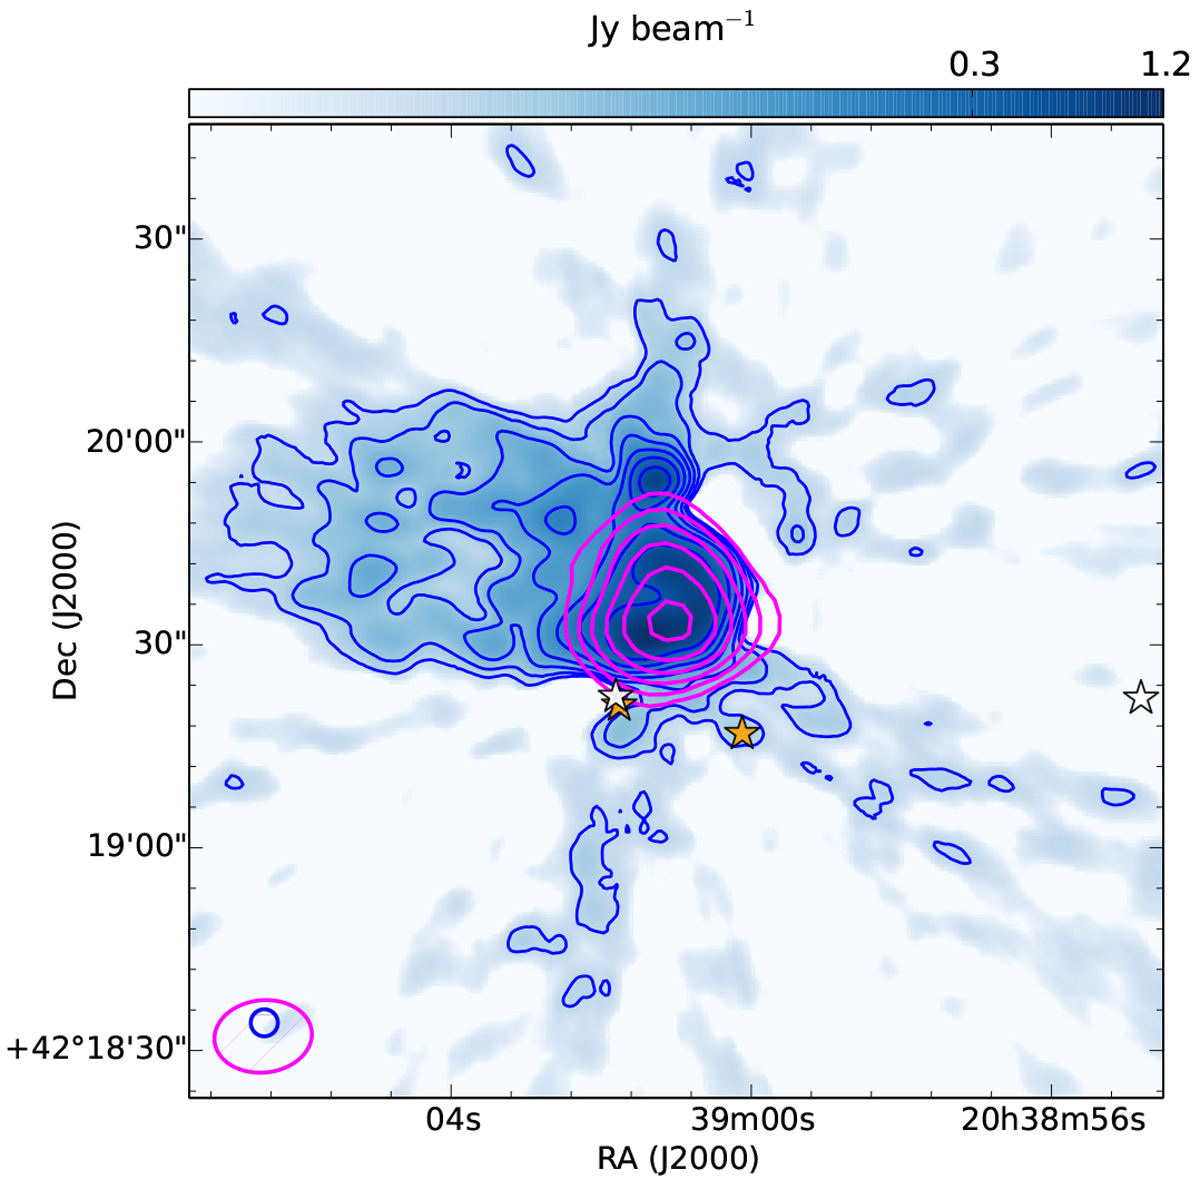
Methanol absorption (magenta contours, integrated from VLSR = −13.9 to 0.5 km s−1) seen in D-array data, overlaid on extended continuum emission toward DR21 (blue scale and contours) as seen in our VLA D+B array configuration map. The
nth contour is at ![]() , where: Smax = 1.2 Jy beam−1,
n = 1, 3, 5..., and p is equal to 0.4% for the radio continuum; and n = 0, 1, 2..., Smax = −3.2 Jy beam−1 km s−1, and p = 16% for the methanol absorption. The synthesized beams (4″ × 4″ for the VLA D+B map and 14.″4 × 10.″7 at PA = −84.1° for the D-configuration map) are shown at the bottom corner. The white stars mark the positions of Class I methanol masers observed in the 95 GHz 81 − 70 A+ line (Plambeck & Menten 1990). The orange stars are 44 GHz 70−61 A+ methanol masers (Kurtz et al. 2004).
, where: Smax = 1.2 Jy beam−1,
n = 1, 3, 5..., and p is equal to 0.4% for the radio continuum; and n = 0, 1, 2..., Smax = −3.2 Jy beam−1 km s−1, and p = 16% for the methanol absorption. The synthesized beams (4″ × 4″ for the VLA D+B map and 14.″4 × 10.″7 at PA = −84.1° for the D-configuration map) are shown at the bottom corner. The white stars mark the positions of Class I methanol masers observed in the 95 GHz 81 − 70 A+ line (Plambeck & Menten 1990). The orange stars are 44 GHz 70−61 A+ methanol masers (Kurtz et al. 2004).
Current usage metrics show cumulative count of Article Views (full-text article views including HTML views, PDF and ePub downloads, according to the available data) and Abstracts Views on Vision4Press platform.
Data correspond to usage on the plateform after 2015. The current usage metrics is available 48-96 hours after online publication and is updated daily on week days.
Initial download of the metrics may take a while.