Fig. 7
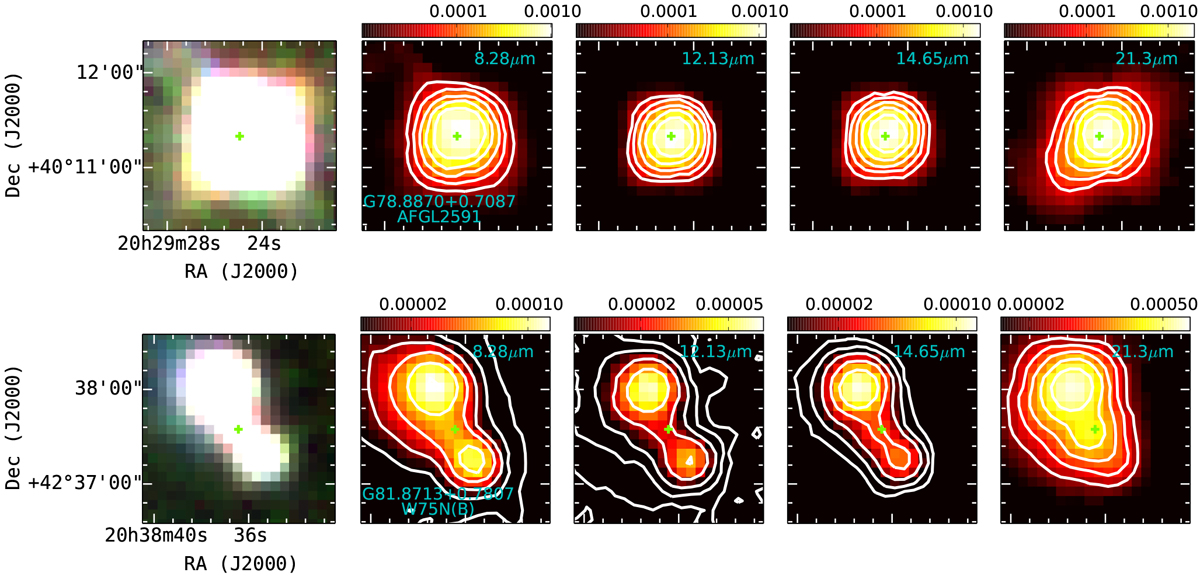
MSX infrared images (color scale and contours) of the environment around the location of G78.8870+0.7087 and G81.8713+0.7807. The Spitzer and WISE images of these two sources are saturated in at least one band. The first panel in each row shows a three-color map constructed using MSX 8.28 μm (blue), 12.13 μm (green), and 14.65 μm (red) images. Other four panels: infrared emission for each of the four MSX bands. The
nth white contour is at ![]() , where Smax
is the maximum flux shown in the color bar (W m−2 sr−1) for each panel, n = 0, 2, 4..., and p
is equal to 3%. The green crosses mark the positions of the masers as measured in D-array configuration maps. The Galactic names of the GLOSTAR sources are indicated at the bottom of the second image in each row.
, where Smax
is the maximum flux shown in the color bar (W m−2 sr−1) for each panel, n = 0, 2, 4..., and p
is equal to 3%. The green crosses mark the positions of the masers as measured in D-array configuration maps. The Galactic names of the GLOSTAR sources are indicated at the bottom of the second image in each row.
Current usage metrics show cumulative count of Article Views (full-text article views including HTML views, PDF and ePub downloads, according to the available data) and Abstracts Views on Vision4Press platform.
Data correspond to usage on the plateform after 2015. The current usage metrics is available 48-96 hours after online publication and is updated daily on week days.
Initial download of the metrics may take a while.