Fig. 2
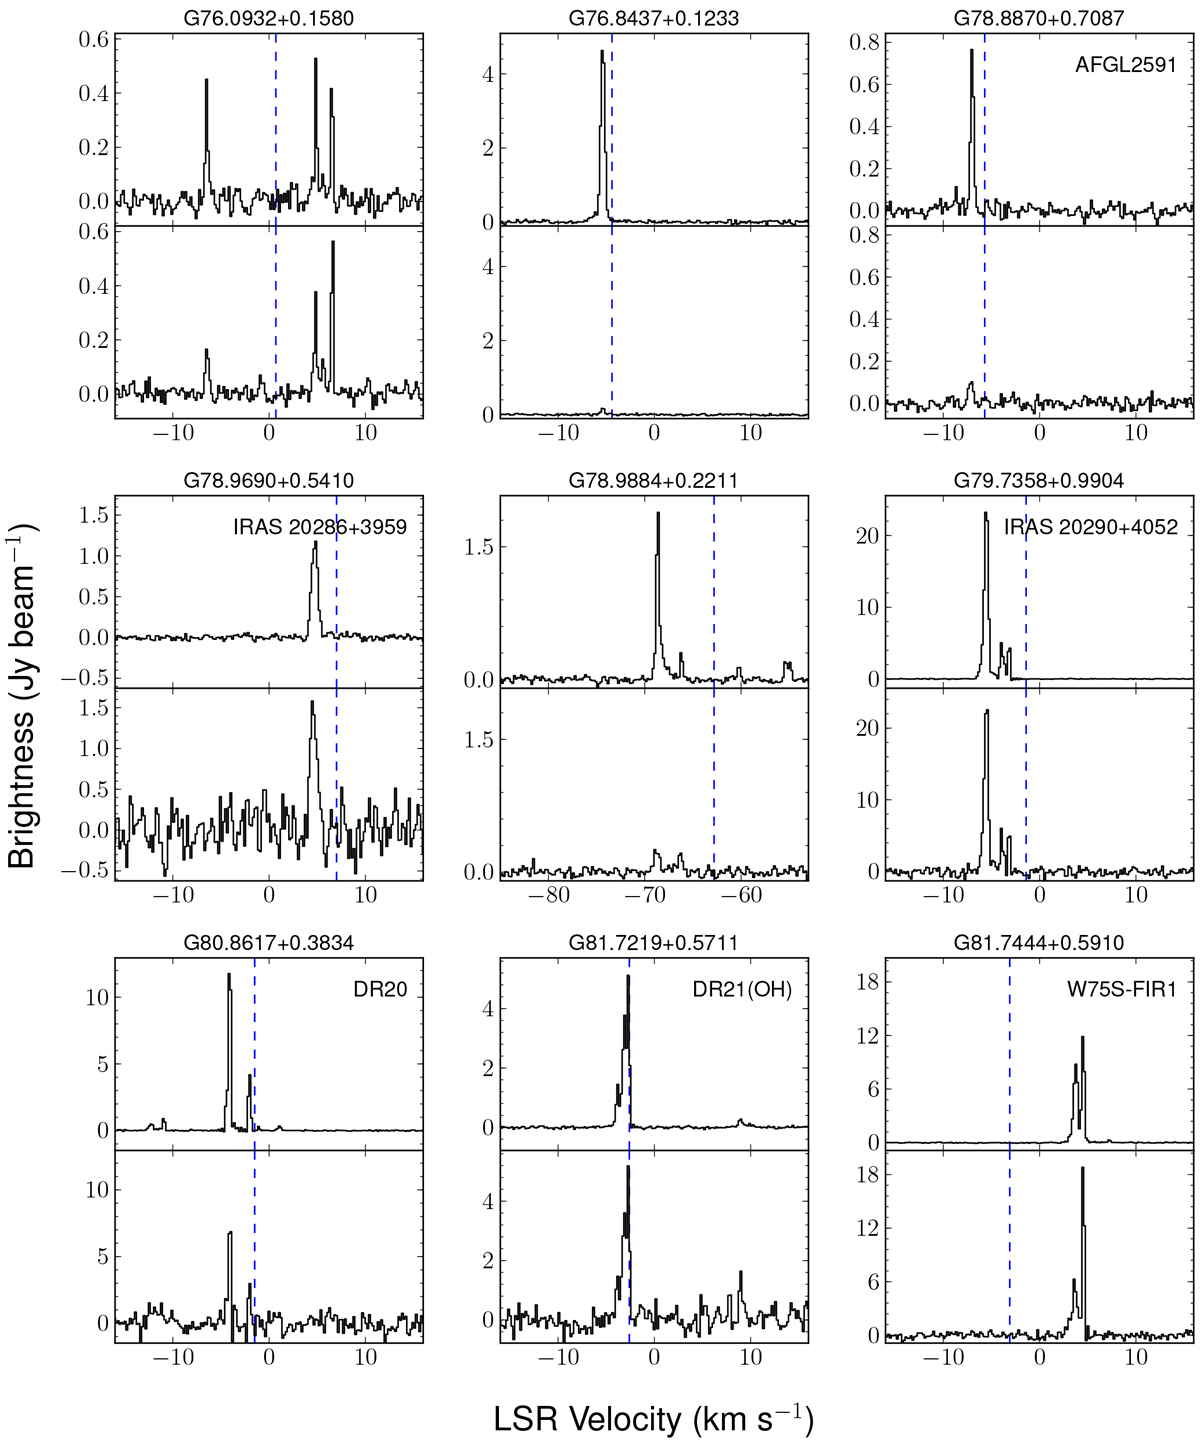
Observed spectra of the 13 sources with methanol maser emission and the one with methanol absorption. For every source, the top and bottom panels represent D- and B-configuration data, respectively. These spectra were extracted at the peak pixel from the data cubes (see text). The vertical lines show the systemic LSR velocities of the dense molecular gas of the star-forming regions that host the masers, which were taken from the literature (see Table 6).
Current usage metrics show cumulative count of Article Views (full-text article views including HTML views, PDF and ePub downloads, according to the available data) and Abstracts Views on Vision4Press platform.
Data correspond to usage on the plateform after 2015. The current usage metrics is available 48-96 hours after online publication and is updated daily on week days.
Initial download of the metrics may take a while.