Fig. A.3
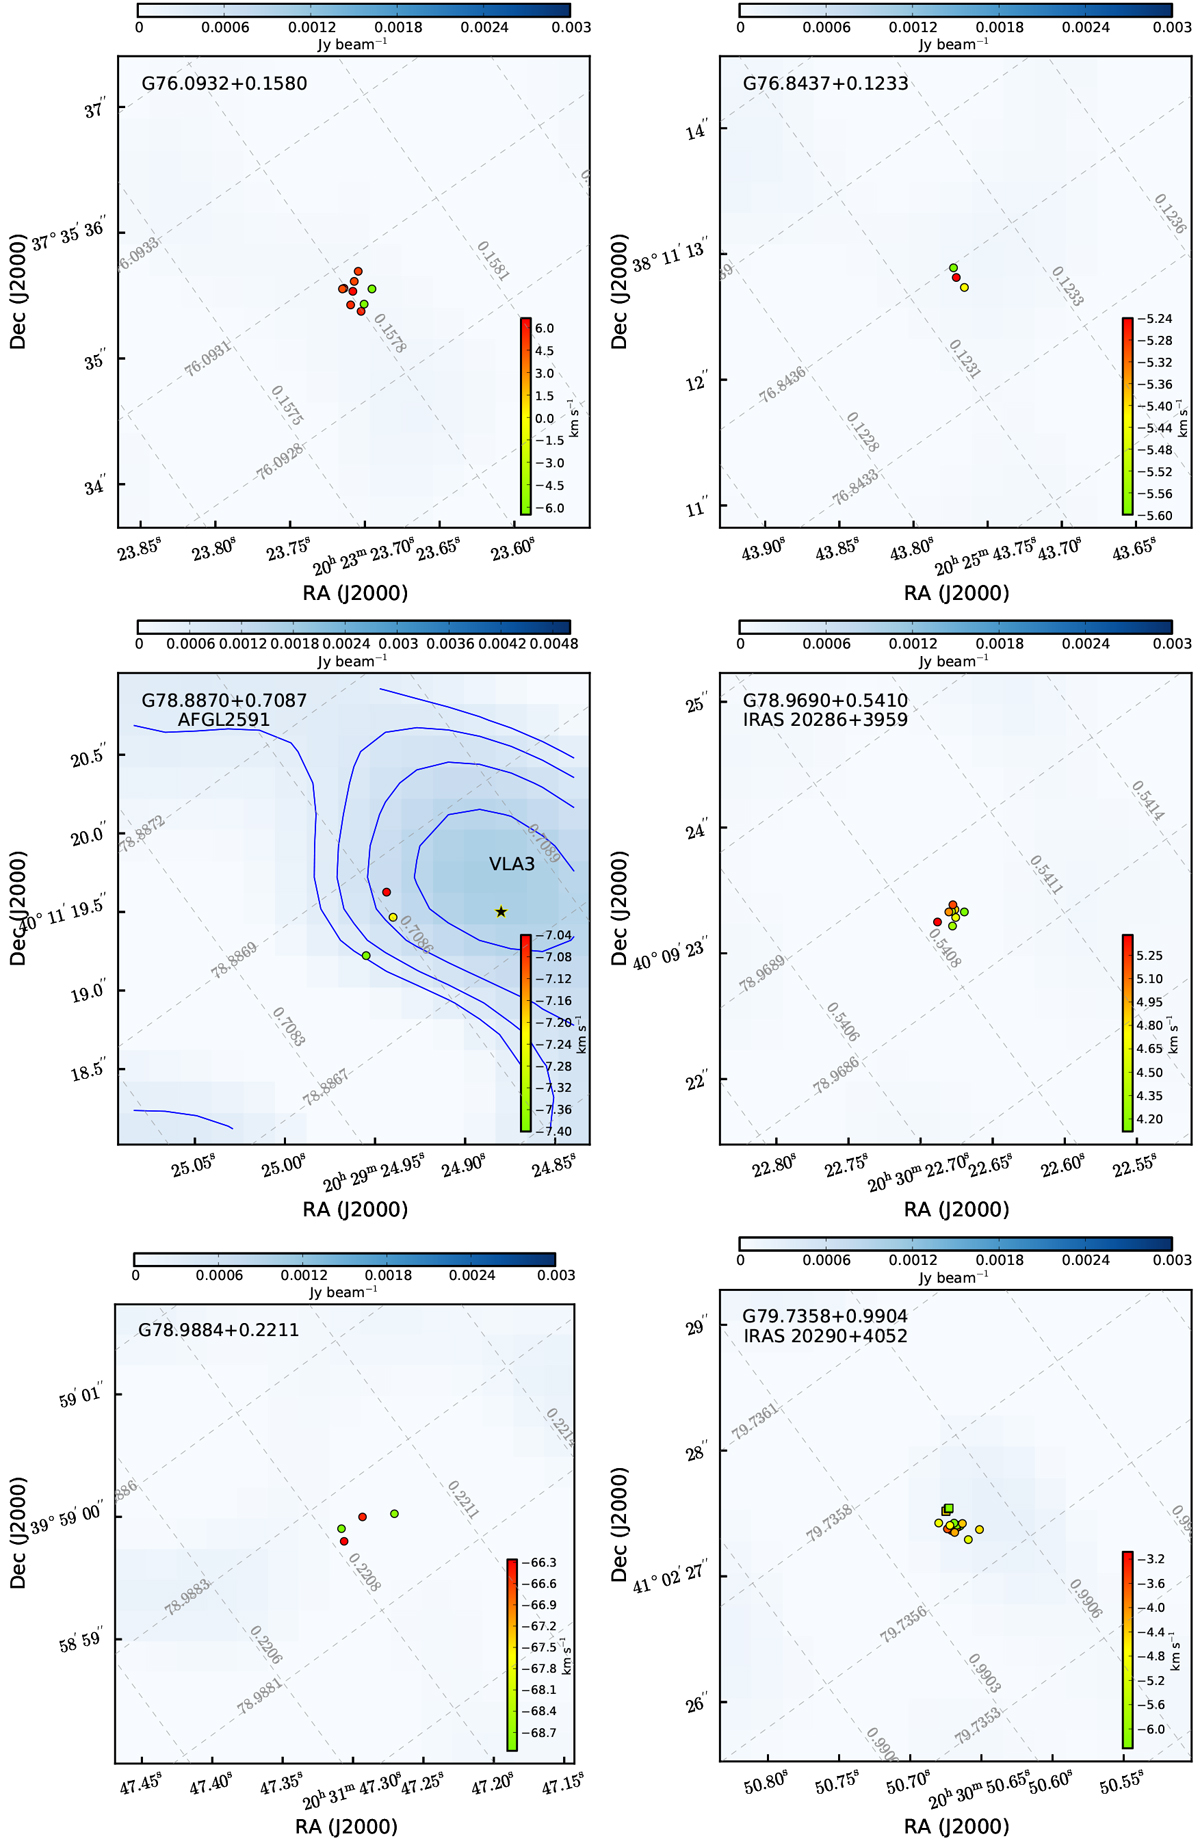
Distribution of all the maser spots (filled circles) contributing to the maser features for B-array data. The background image shows B-configuration continuum emission (blue scale and contours). The spots are color coded by LSR velocity (color bar). The
nth blue contour is at ![]() , where Smax is the maximum continuum flux shown in the blue bar for each panel, n = 0, 1, 2..., and p is equal to 10%. Positions of radio continuum sources identified in previous observations are marked with black stars alongwith their names. Maser spots detected with the EVN by Rygl et al. (2012) are shown as filled squares. The gray grid shows the Galactic coordinate system. The beam size of the radio continuum maps is 1.″5 × 1.″5. The maser position errors are ≈0.″2 (see Sect. 3).
, where Smax is the maximum continuum flux shown in the blue bar for each panel, n = 0, 1, 2..., and p is equal to 10%. Positions of radio continuum sources identified in previous observations are marked with black stars alongwith their names. Maser spots detected with the EVN by Rygl et al. (2012) are shown as filled squares. The gray grid shows the Galactic coordinate system. The beam size of the radio continuum maps is 1.″5 × 1.″5. The maser position errors are ≈0.″2 (see Sect. 3).
Current usage metrics show cumulative count of Article Views (full-text article views including HTML views, PDF and ePub downloads, according to the available data) and Abstracts Views on Vision4Press platform.
Data correspond to usage on the plateform after 2015. The current usage metrics is available 48-96 hours after online publication and is updated daily on week days.
Initial download of the metrics may take a while.