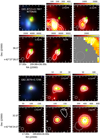
Fig. A.2
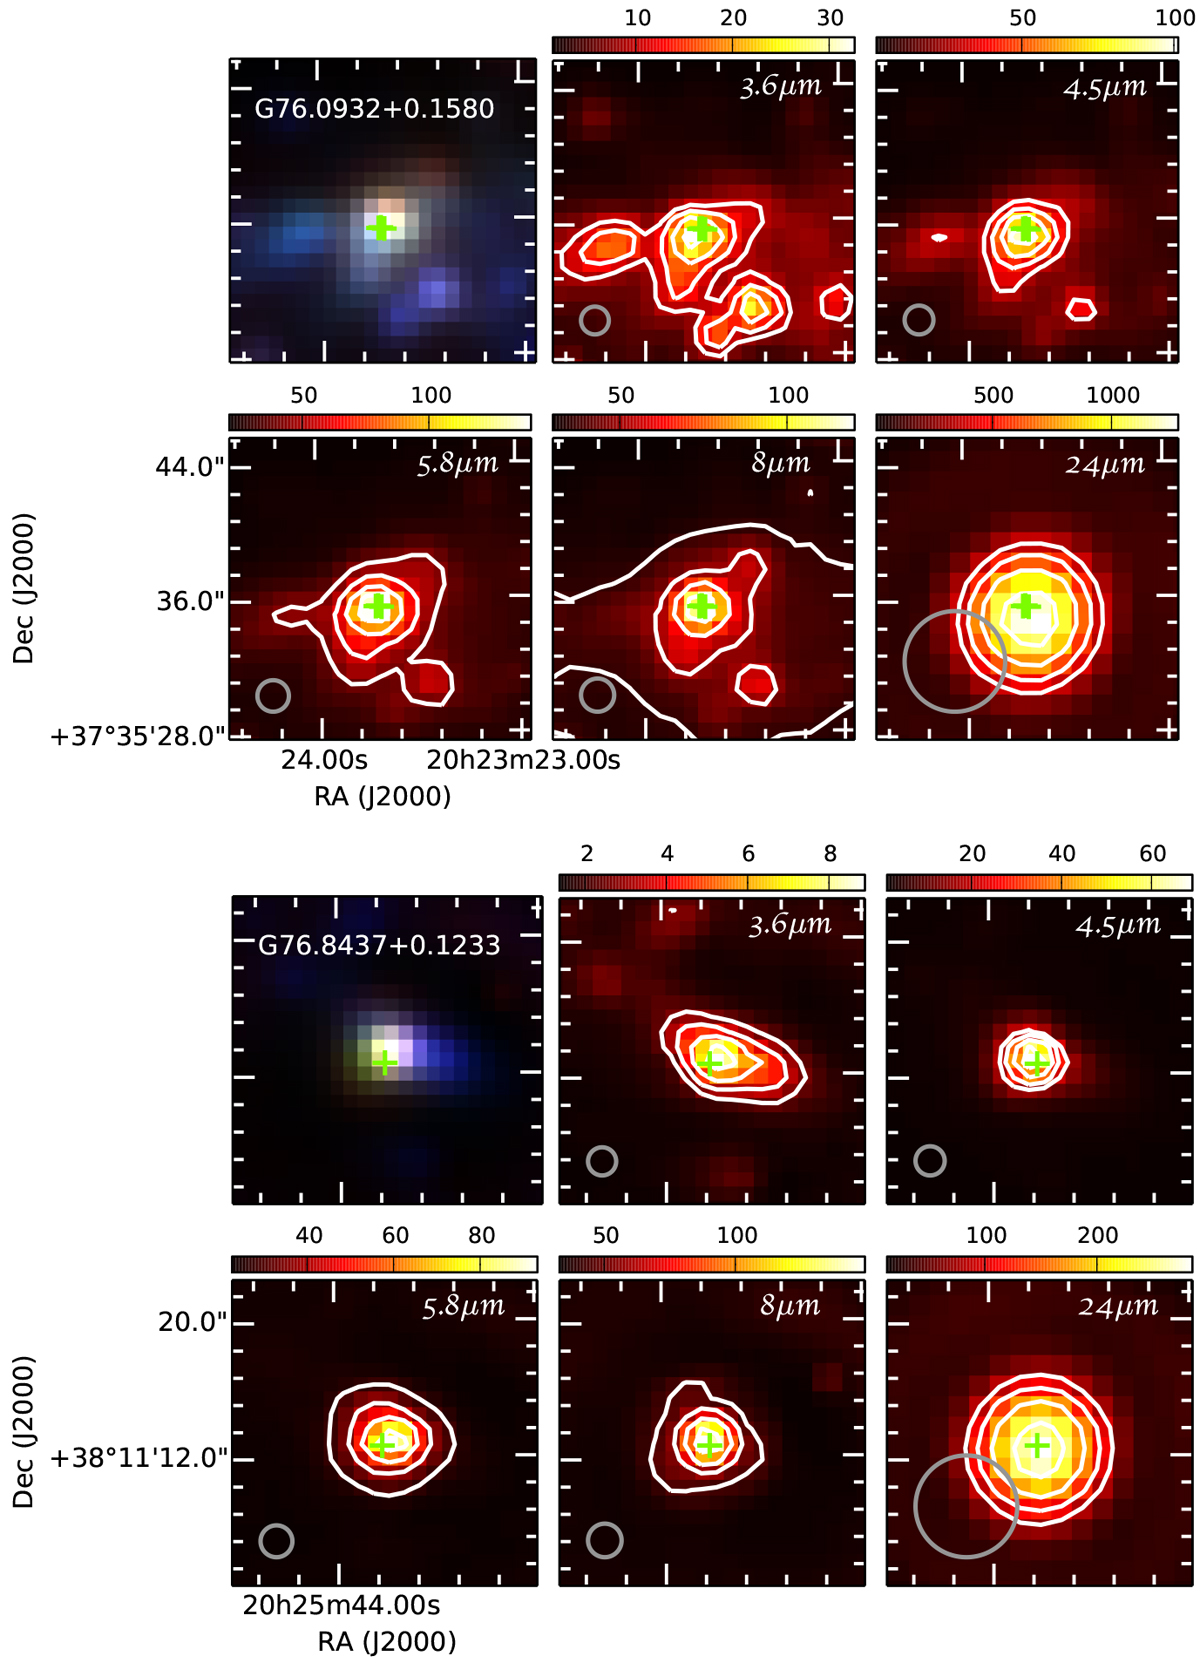
Infrared images (color scale and contours) of the environment around the location of the VLA-detected methanol masers. The top-left panel shows a three-color map constructed using Spitzer 3.6 μm (blue), 4.5 μm (green), and 8 μm (red) images. The other five panels show infrared emission for each of the Spitzer bands. The nth white contour is at ![]() , where Smax is the maximum flux shown in the color bar (MJy sr−1) for each panel, n = 0, 1, 2..., and p is equal to 30%. The green crosses mark the positions of the maser features seen in B-array configuration maps. The Galactic names of the GLOSTAR sources are indicated at the top of the top-left panels. The beams are shown at the bottom-left corner of each panel. Saturated pixels are shown in gray.
, where Smax is the maximum flux shown in the color bar (MJy sr−1) for each panel, n = 0, 1, 2..., and p is equal to 30%. The green crosses mark the positions of the maser features seen in B-array configuration maps. The Galactic names of the GLOSTAR sources are indicated at the top of the top-left panels. The beams are shown at the bottom-left corner of each panel. Saturated pixels are shown in gray.
Current usage metrics show cumulative count of Article Views (full-text article views including HTML views, PDF and ePub downloads, according to the available data) and Abstracts Views on Vision4Press platform.
Data correspond to usage on the plateform after 2015. The current usage metrics is available 48-96 hours after online publication and is updated daily on week days.
Initial download of the metrics may take a while.