Fig. 10
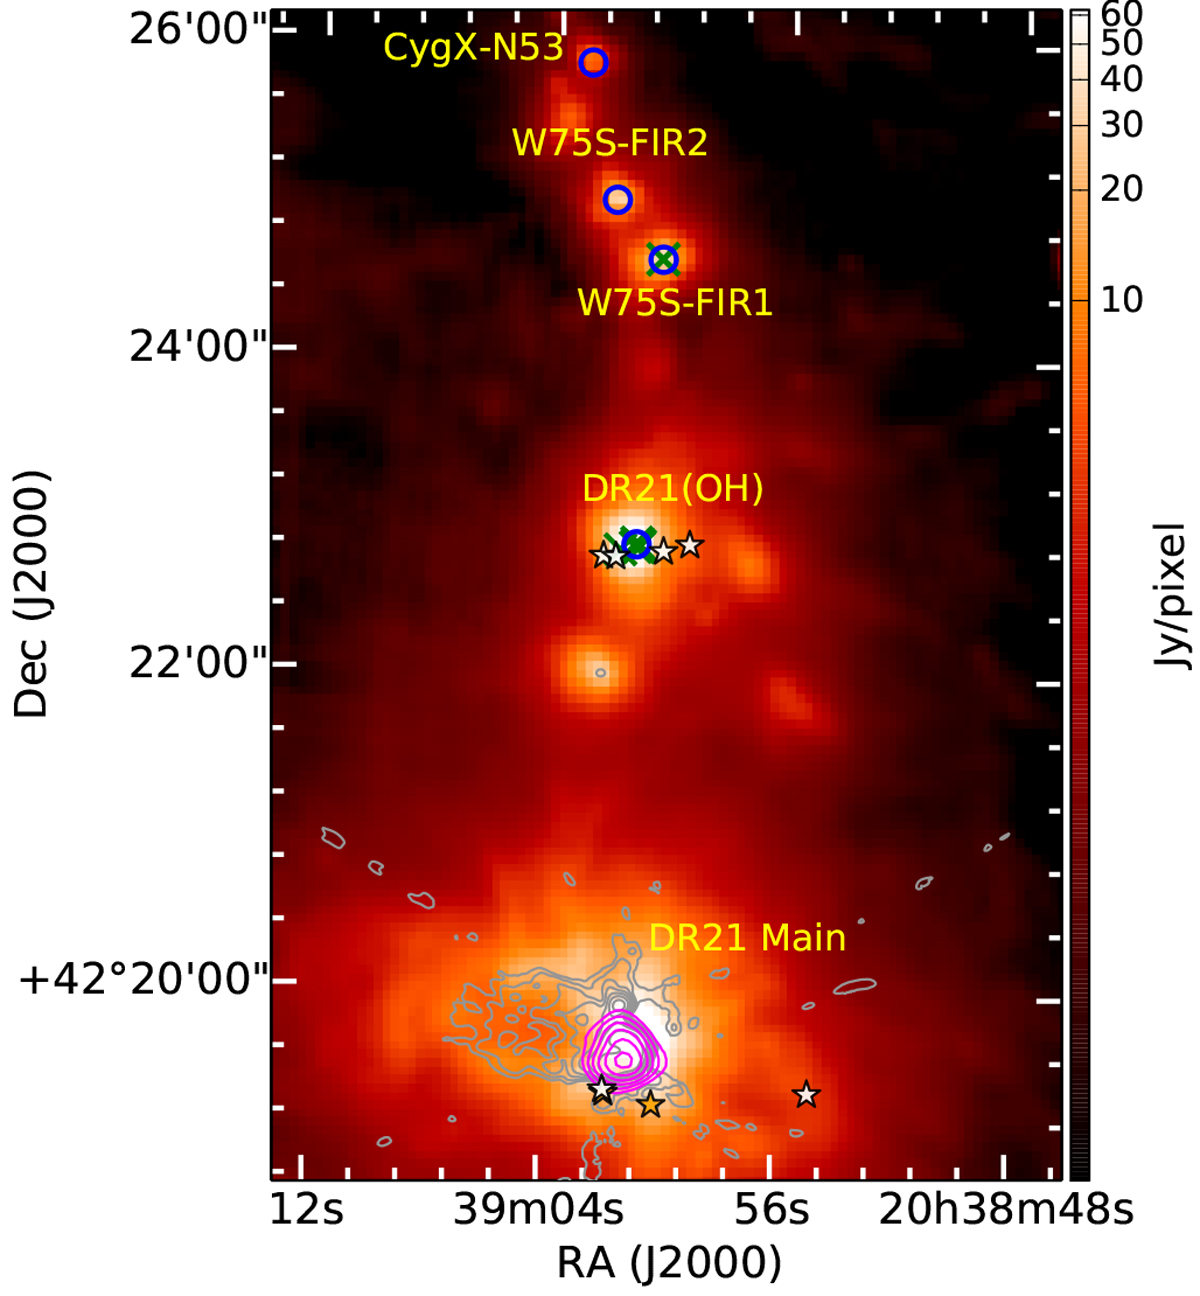
Locations of 6.7 GHz Class II methanol masers detected with the VLA (blue circles) toward the dense molecular ridge extending from DR 21 M in the south to DR 21 (OH) (and beyond), overlaid on a 70 μm dust continuum image obtained with Herschel (red scale; Hennemann et al. 2012). Gray contours represent the GLOSTAR combined B+D-array continuum emission. The magenta contours show the velocity-integrated absorption of the 6.7 GHz methanol line. The
nth contour is at ![]() , where: Smax = 1.2 Jy beam−1,
n = 1, 3, 5..., and p
is equal to 0.4% for the continuum; and n = 0, 1, 2..., Smax = −3.2 Jy beam−1 km s−1, and p = 16% for the methanol absorption. The white stars and green Xs mark, respectively, the positions of Class I methanol masers observed in the 95 GHz 81−70 A+
line (Plambeck & Menten 1990) and the 18 cm OH masers associated with DR21(OH) and W75S-FIR 1 (Norris et al. 1982; Argon et al. 2000). The orange stars represent 44 GHz Class I methanol masers (Kurtz et al. 2004).
, where: Smax = 1.2 Jy beam−1,
n = 1, 3, 5..., and p
is equal to 0.4% for the continuum; and n = 0, 1, 2..., Smax = −3.2 Jy beam−1 km s−1, and p = 16% for the methanol absorption. The white stars and green Xs mark, respectively, the positions of Class I methanol masers observed in the 95 GHz 81−70 A+
line (Plambeck & Menten 1990) and the 18 cm OH masers associated with DR21(OH) and W75S-FIR 1 (Norris et al. 1982; Argon et al. 2000). The orange stars represent 44 GHz Class I methanol masers (Kurtz et al. 2004).
Current usage metrics show cumulative count of Article Views (full-text article views including HTML views, PDF and ePub downloads, according to the available data) and Abstracts Views on Vision4Press platform.
Data correspond to usage on the plateform after 2015. The current usage metrics is available 48-96 hours after online publication and is updated daily on week days.
Initial download of the metrics may take a while.