Fig. 1
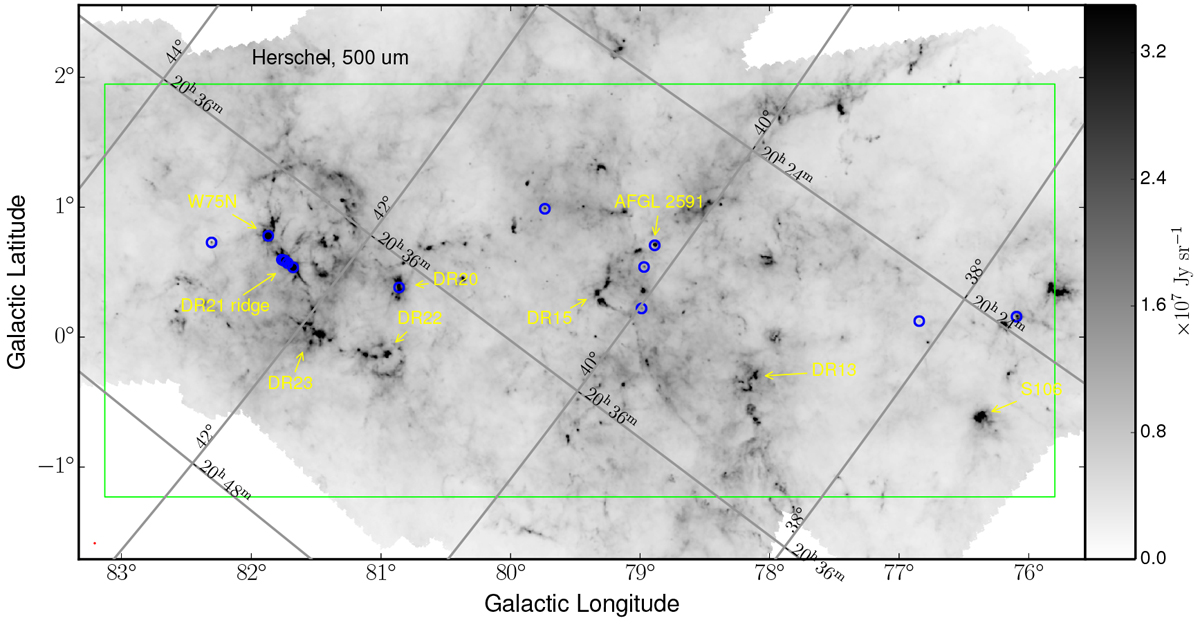
Locations of methanol sources detected with the VLA (blue circles), overlaid on a Herschel SPIRE 500 μm continuum image of the Cygnus X region (grayscale). The mosaic was generated by Cao et al. (2019) from data obtained as part of the HOBYS (Motte et al. 2010; Hennemann et al. 2014) and Hi-GAL projects (Molinari et al. 2010). The region outlined in green represents the area mapped with GLOSTAR. A few well-known star-forming regions and radio continuum sources (Downes & Rinehart 1966) are labeled in yellow.
Current usage metrics show cumulative count of Article Views (full-text article views including HTML views, PDF and ePub downloads, according to the available data) and Abstracts Views on Vision4Press platform.
Data correspond to usage on the plateform after 2015. The current usage metrics is available 48-96 hours after online publication and is updated daily on week days.
Initial download of the metrics may take a while.