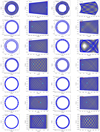
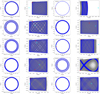
Fig. A.1
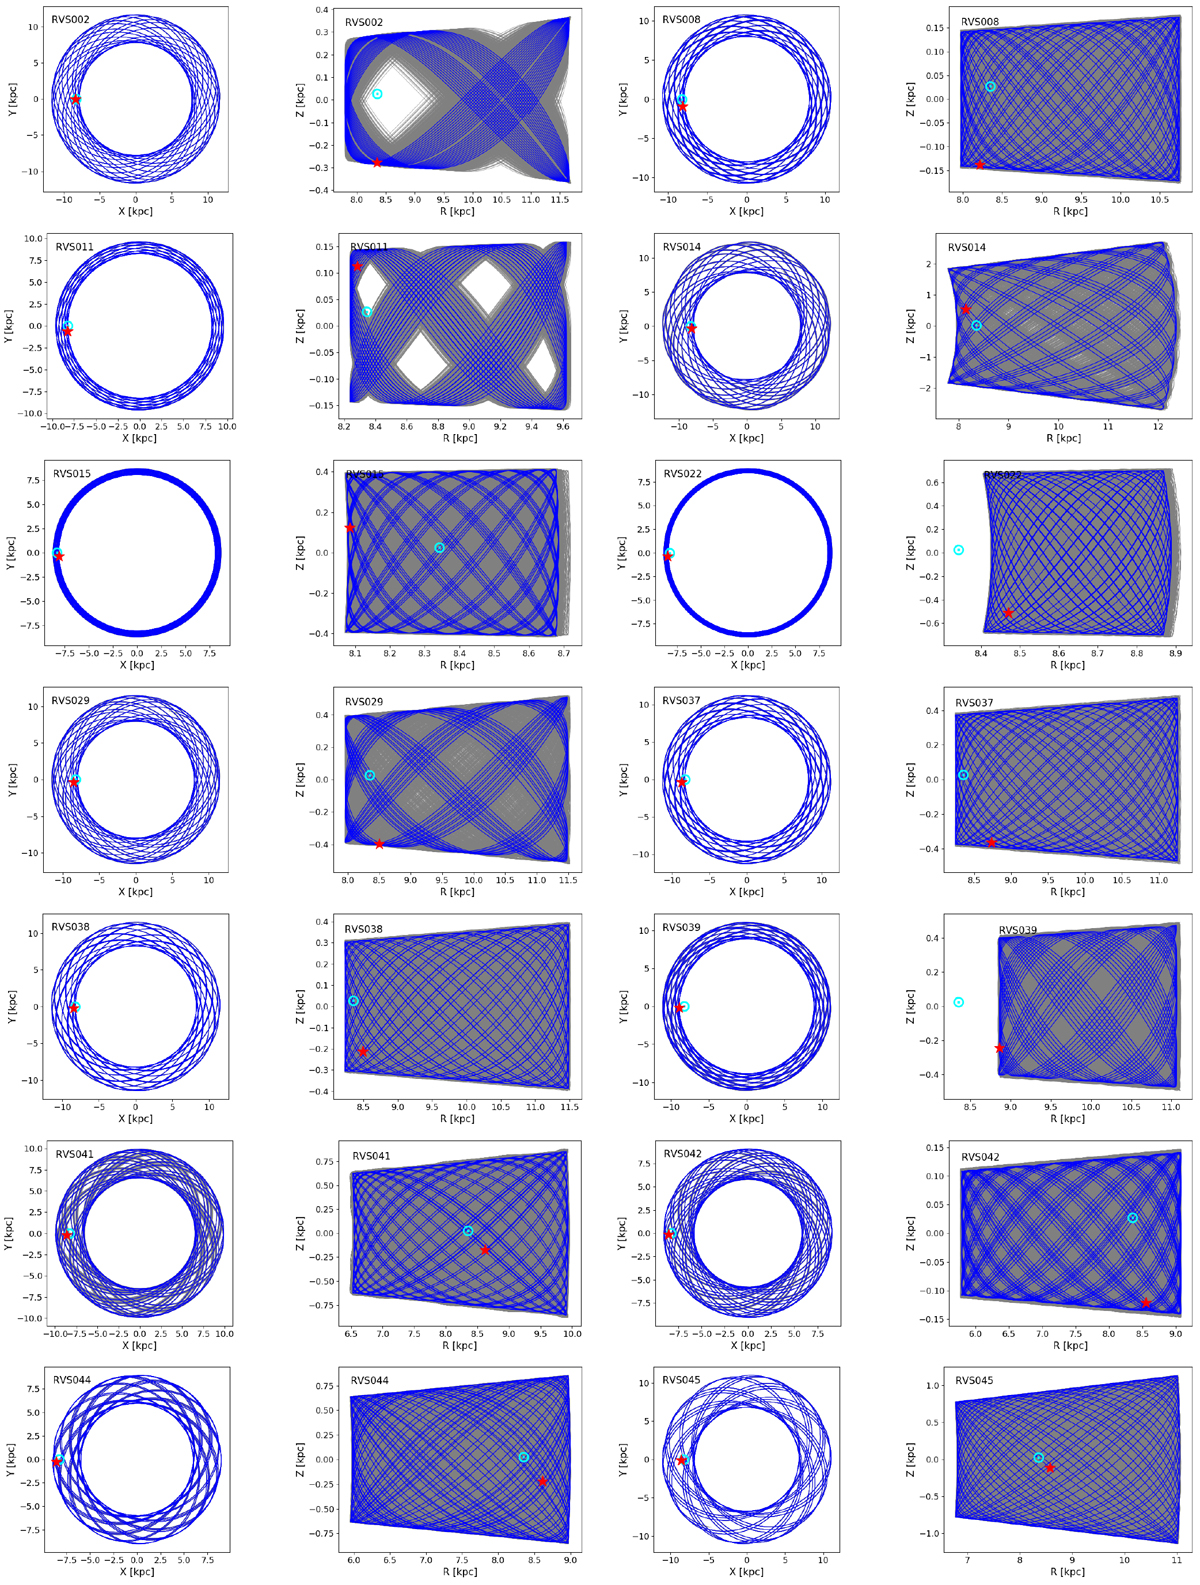
Projection on the X–Y plane and on the R–Z plane of the orbits of the stars in the sample. The blue line corresponds to the mean orbit of each star, the grey lines to the 100 realisations of this orbit after errors on the observables (parallaxes, proper motions, and line-of-sight velocities) are taken into account, as described in Sect. 4.5. The cyan symbol indicates the position of the Sun, and the red star shows the current position of the star. The ID of each star is reported in the top left corner of each panel.
Current usage metrics show cumulative count of Article Views (full-text article views including HTML views, PDF and ePub downloads, according to the available data) and Abstracts Views on Vision4Press platform.
Data correspond to usage on the plateform after 2015. The current usage metrics is available 48-96 hours after online publication and is updated daily on week days.
Initial download of the metrics may take a while.