Fig. 8
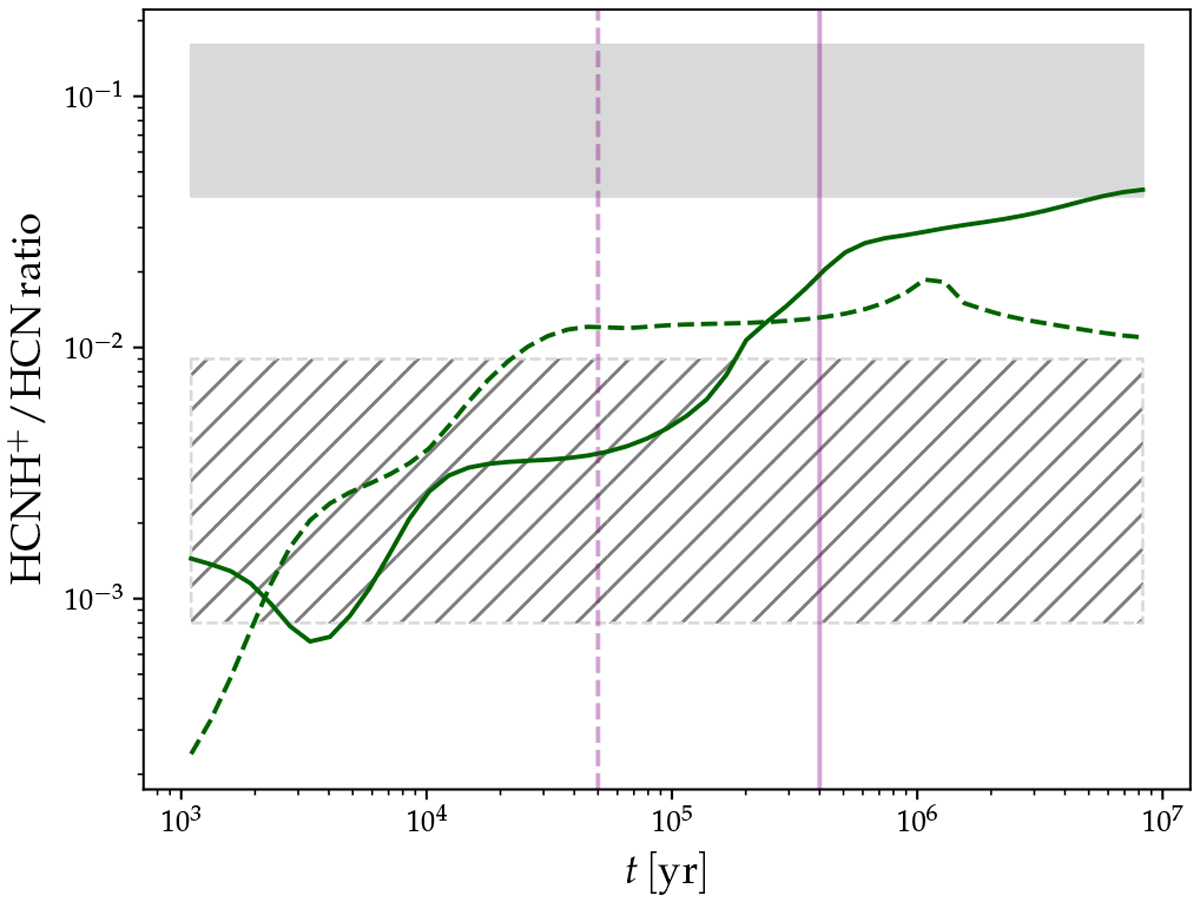
Predicted HCNH+/HCN ratio for the CM (green solid line) and for the WM (dashed green line). The grey shaded areas represent the range of observed HCNH+/HCN ratios for the CM (filled area), and for the WM (striped area). The purple vertical lines indicate the times at which the abundances of HCNH+, HCN, and HCO+ are reproduced by the CM (tCM = 4 × 10⁵ yr, solid line), and by the WM (tWM = 5 × 10⁴ yr, dashed line).
Current usage metrics show cumulative count of Article Views (full-text article views including HTML views, PDF and ePub downloads, according to the available data) and Abstracts Views on Vision4Press platform.
Data correspond to usage on the plateform after 2015. The current usage metrics is available 48-96 hours after online publication and is updated daily on week days.
Initial download of the metrics may take a while.