Fig. 5
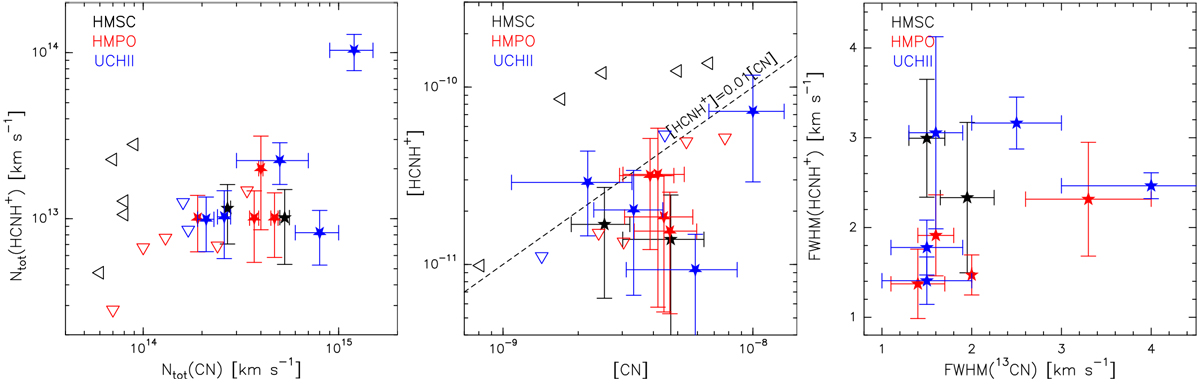
Same as Fig. 3, but for the comparison between HCNH+ and CN. For CN, Ntot (left panel), [CN] (middle panel), and FWHM (right panel) are derived from observations of the 13 CN N = 2− 1 line at ~217 GHz, published in Fontani et al. (2015b). Ntot (HCNH+) and Ntot (CN) are averaged within the same beam of ~11′′, and left-pointing triangles are upper limits on Ntot (CN), while down-pointing triangles are upper limits on Ntot (HCNH+). [HCNH+] and [CN] areaveraged within a beam of 28′′.
Current usage metrics show cumulative count of Article Views (full-text article views including HTML views, PDF and ePub downloads, according to the available data) and Abstracts Views on Vision4Press platform.
Data correspond to usage on the plateform after 2015. The current usage metrics is available 48-96 hours after online publication and is updated daily on week days.
Initial download of the metrics may take a while.