Fig. 4
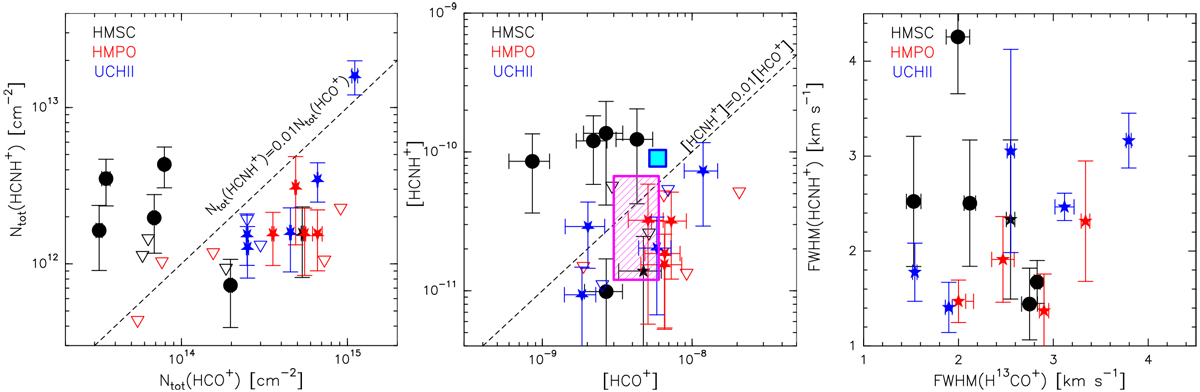
Left panel: comparison between Ntot (HCNH+) and Ntot (HCO+). The latter was computed from Ntot (H13 CO+) taken from Fontani et al. (2018) by correcting it for the 12C/13C ratio obtained at the Galactocentric distance of the sources from the trend of Yan et al. (2019). Middle panel: same as left panel, but for the abundances relative to H2. As in the middle panel of Fig. 3, the purple rectangle and the cyan square show the predictions of the WM and CM (Sect. 5 and Fig. 7), respectively, that best reproduce the observed abundances of the three species HCNH+, HCN, and HCO+. Right panel: comparison between the line FWHM of HCNH+, derived in this work from the J = 3−2 line, and H13CO+, derived in Fontani et al. (2018) from the J = 1−0 line at ~87 GHz. The symbols have the same meaning as those in the left and middle panels.
Current usage metrics show cumulative count of Article Views (full-text article views including HTML views, PDF and ePub downloads, according to the available data) and Abstracts Views on Vision4Press platform.
Data correspond to usage on the plateform after 2015. The current usage metrics is available 48-96 hours after online publication and is updated daily on week days.
Initial download of the metrics may take a while.