Free Access
Fig. 10
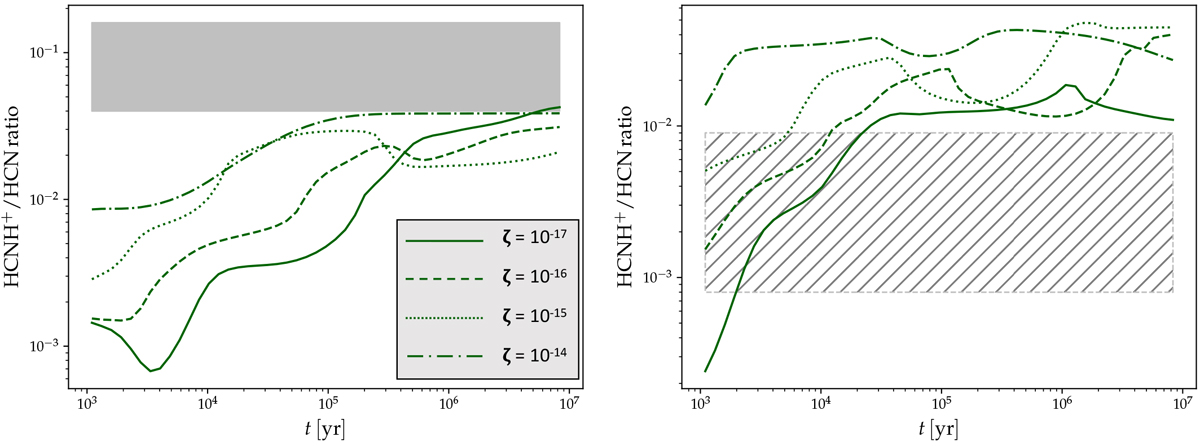
Predicted HCNH+/HCN ratio for the CM (left panel) and the WM (right panel), assuming different cosmic-ray ionisation rates, ζ. The grey shaded areas represent the range of observed HCNH+/HCN ratios for the CM (filled area in the left panel), and for the WM (striped area in the right panel).
Current usage metrics show cumulative count of Article Views (full-text article views including HTML views, PDF and ePub downloads, according to the available data) and Abstracts Views on Vision4Press platform.
Data correspond to usage on the plateform after 2015. The current usage metrics is available 48-96 hours after online publication and is updated daily on week days.
Initial download of the metrics may take a while.