Fig. 5.
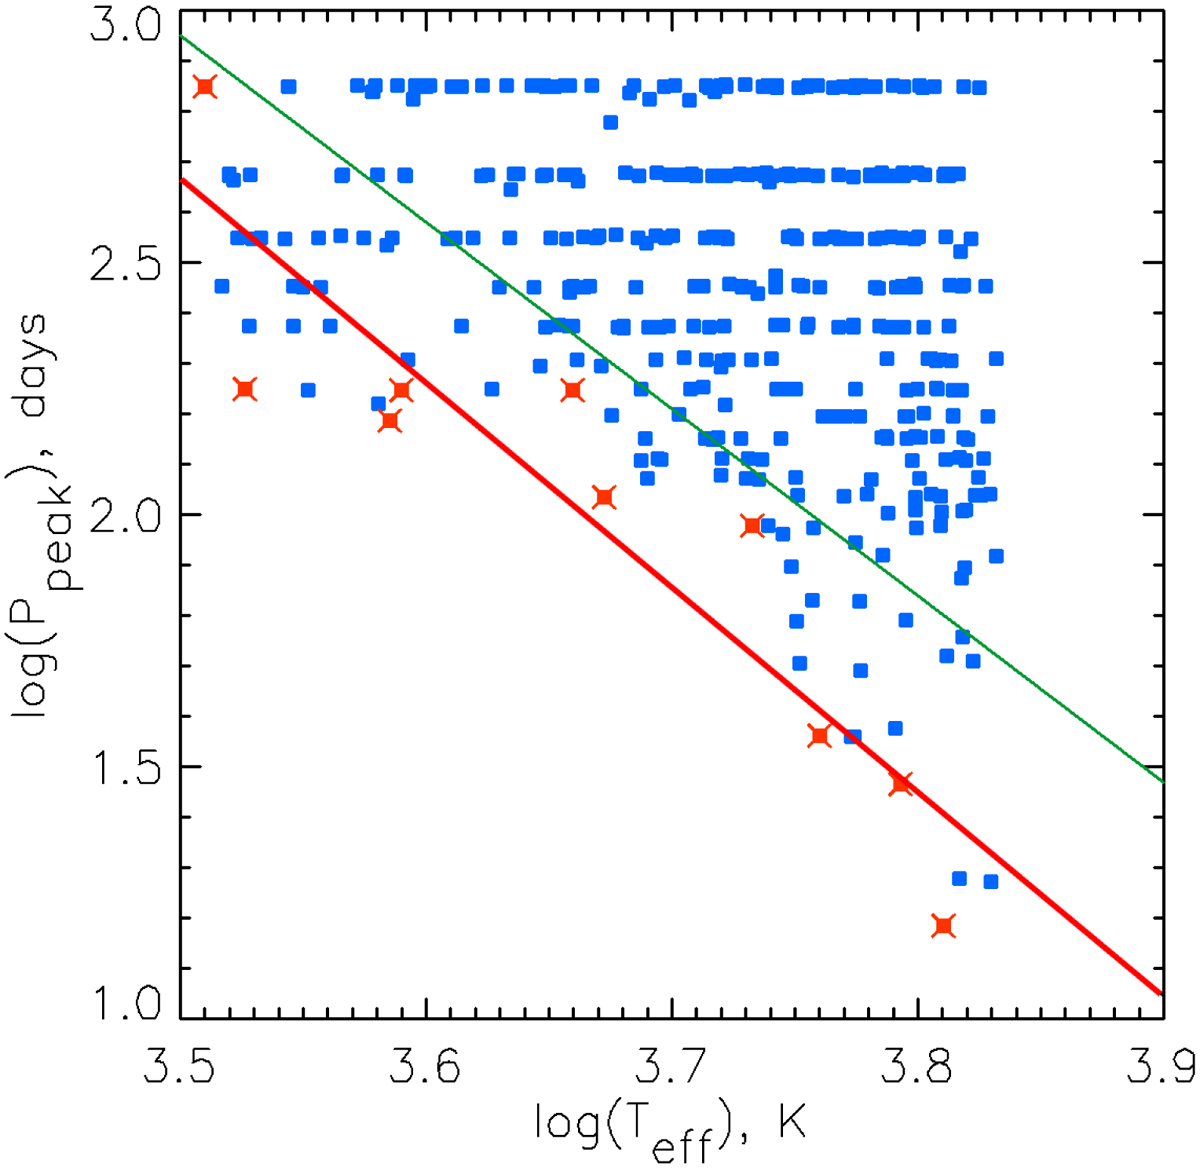
Distribution of the log(Ppeak) estimates vs. log(Teff) for the same subset of fast rotating stars with 1 < P < 4 days as processed by other methods in Arkhypov et al. (2015b). The red line shows the linear regression of the lower border set of the log(Ppeak) cluster, obtained for the minimum values of Ppeak (red crossed squares) defined for the sequential ten intervals of Teff. The green line shows linear regression of log(Pcyc(log(Teff))) obtained in Arkhypov et al. (2015b) by other methods. The detection limit zone for Ppeak, restricted by the Nyquist frequency (2P)−1 for the considered subset of fast rotators appears outside of the displayed frame.
Current usage metrics show cumulative count of Article Views (full-text article views including HTML views, PDF and ePub downloads, according to the available data) and Abstracts Views on Vision4Press platform.
Data correspond to usage on the plateform after 2015. The current usage metrics is available 48-96 hours after online publication and is updated daily on week days.
Initial download of the metrics may take a while.