Free Access
Fig. 7.
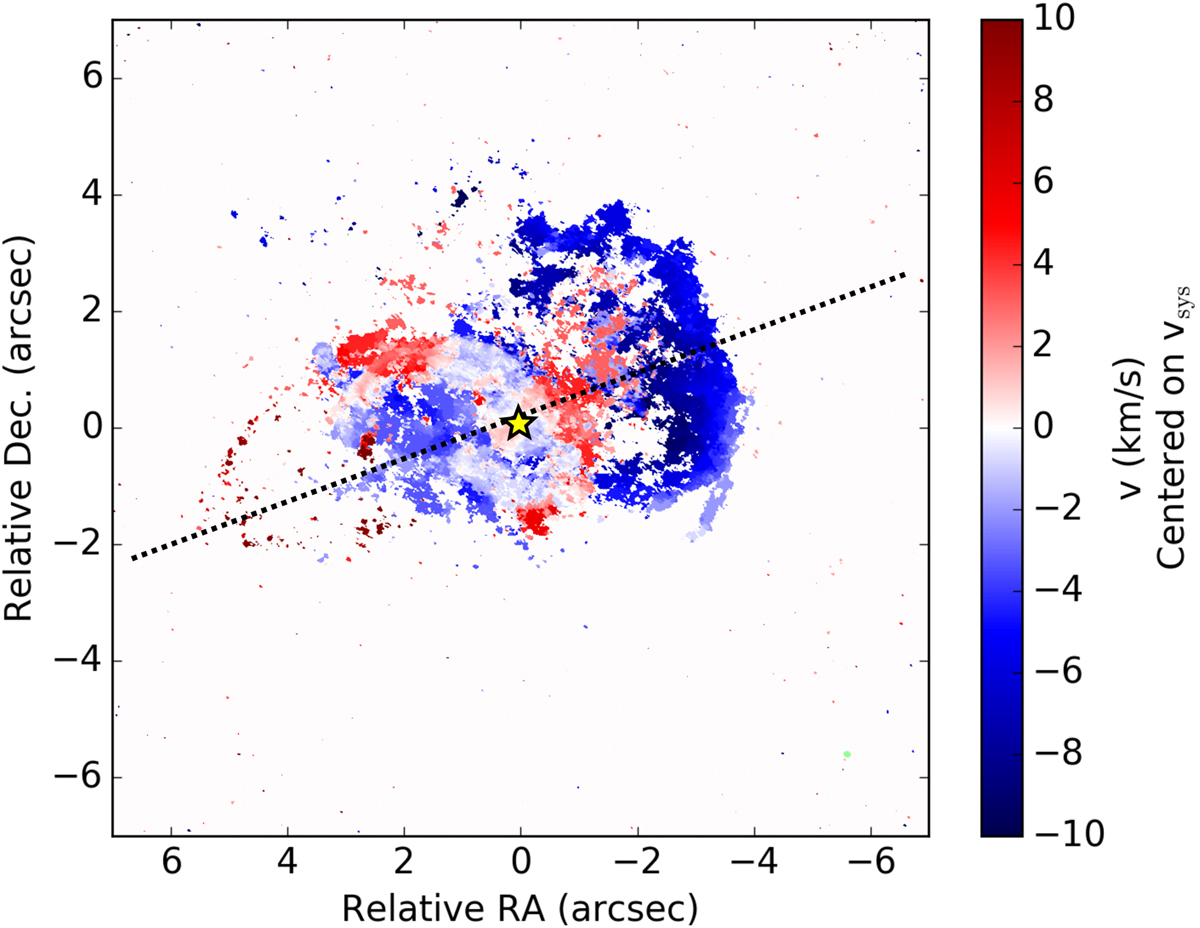
Moment 1 map of the HR CO data. The dashed line represents the alignment axis separating the eastern and western bubbles, which has a position angle of ∼115° (see also orange line in Fig. 8). The continuum peak is indicated by a yellow star. The small green ellipse in the bottom right corner is the ALMA beam.
Current usage metrics show cumulative count of Article Views (full-text article views including HTML views, PDF and ePub downloads, according to the available data) and Abstracts Views on Vision4Press platform.
Data correspond to usage on the plateform after 2015. The current usage metrics is available 48-96 hours after online publication and is updated daily on week days.
Initial download of the metrics may take a while.