Fig. A.1.
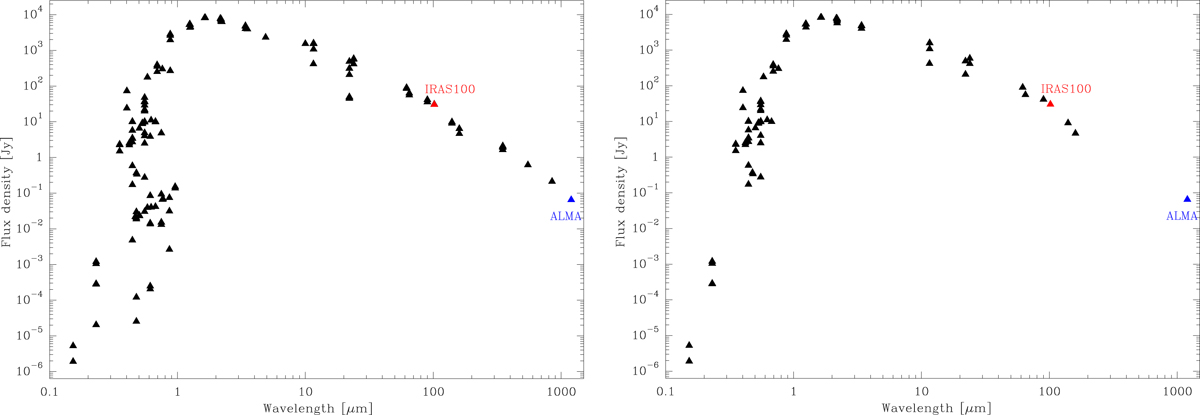
Spectral energy distribution for R Hya using the continuum measurements obtained from Vizier (http://vizier.u-strasbg.fr/vizier/sed/) for a radius of 30″ (left panel), and 1″ (right panel), centred on the source. The flux density of the IRAS measurement at 100 microns (Hashimoto et al. 1998) and of our ALMA observation at 250 GHz are shown in red and blue, respectively.
Current usage metrics show cumulative count of Article Views (full-text article views including HTML views, PDF and ePub downloads, according to the available data) and Abstracts Views on Vision4Press platform.
Data correspond to usage on the plateform after 2015. The current usage metrics is available 48-96 hours after online publication and is updated daily on week days.
Initial download of the metrics may take a while.