Fig. 15.
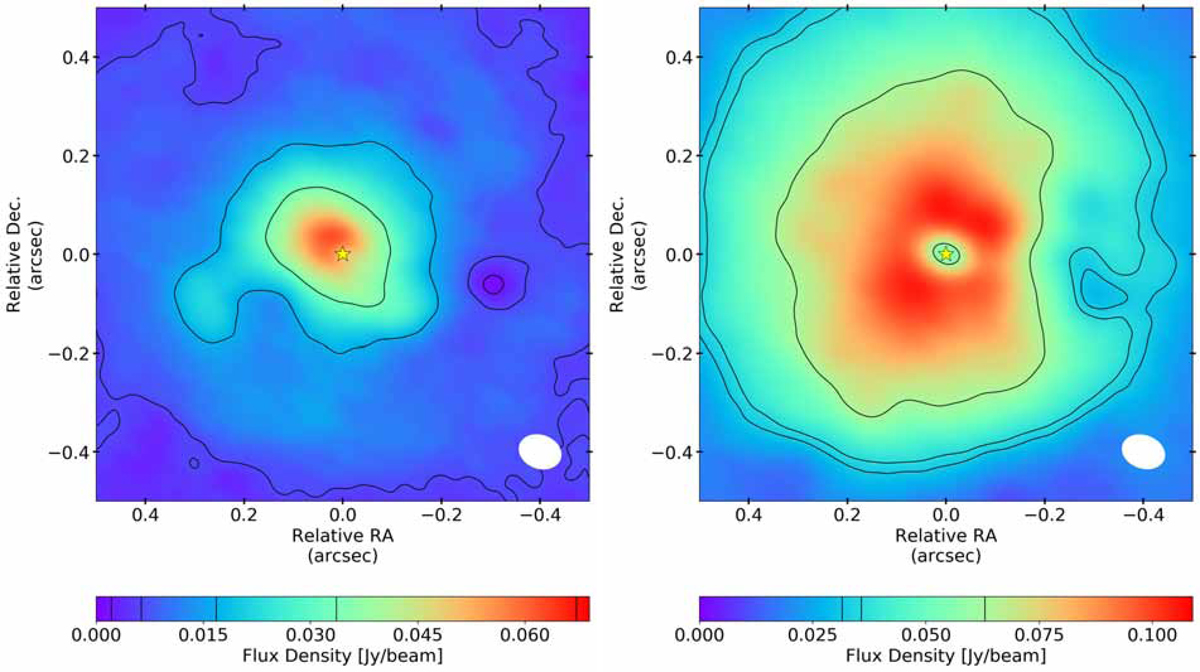
Channel maps where an unresolved emission void is detected about 0.3″ to the west of the AGB star (indicated by the yellow star). Left: CO channel at 0.5 km s−1, contour levels [3, 9, 24, 48, 96] ×σrms. Right: SiO channel at 0.6 km s−1, contour levels [46, 51, 90] ×σrms. The contour levels have been chosen to highlight the feature.
Current usage metrics show cumulative count of Article Views (full-text article views including HTML views, PDF and ePub downloads, according to the available data) and Abstracts Views on Vision4Press platform.
Data correspond to usage on the plateform after 2015. The current usage metrics is available 48-96 hours after online publication and is updated daily on week days.
Initial download of the metrics may take a while.