Fig. 14.
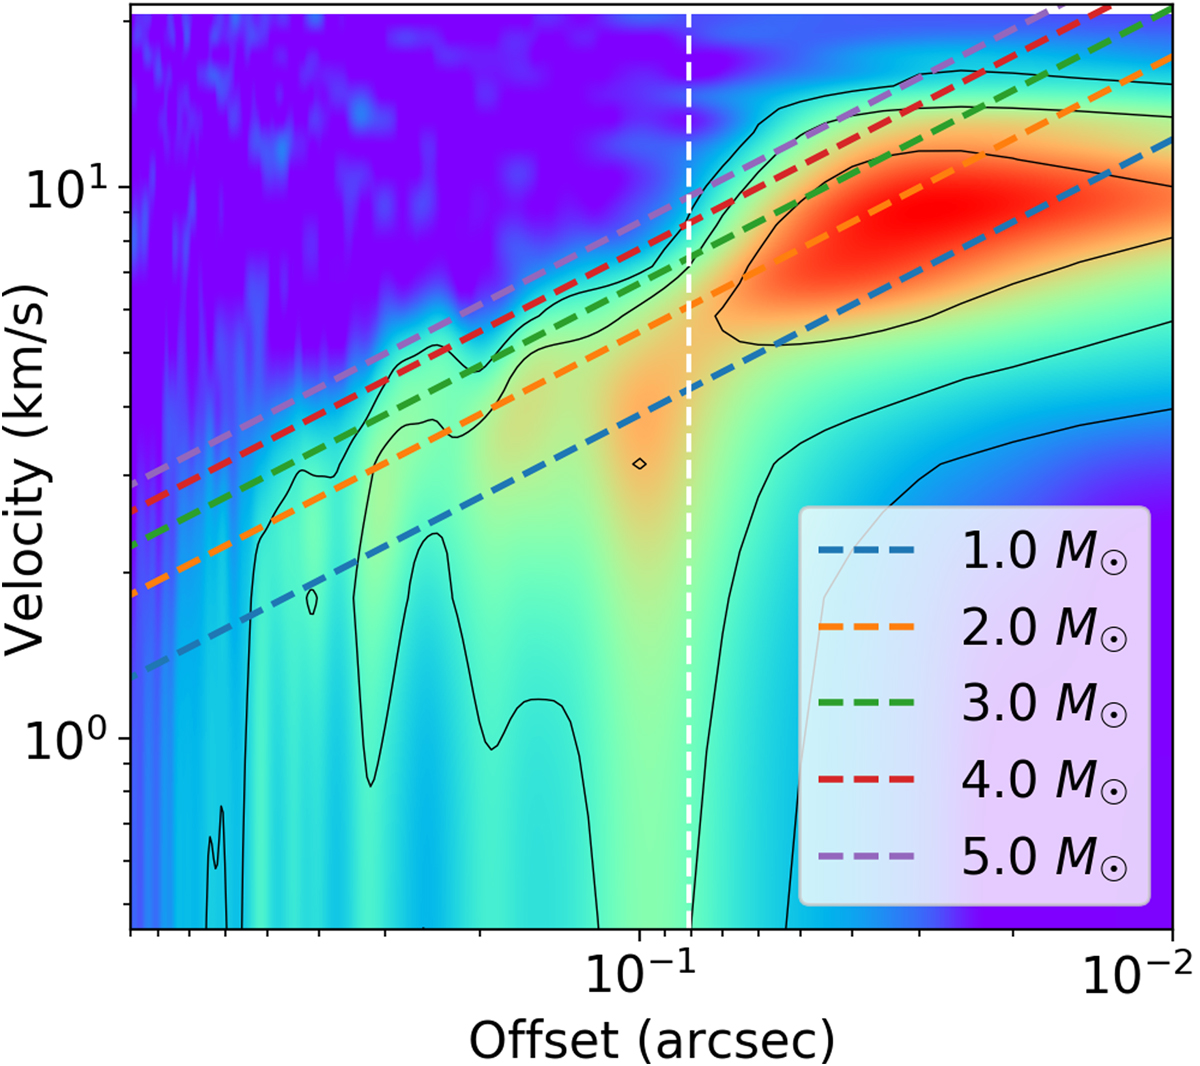
First quadrant of the PV diagram of the extended SiO data (Fig. 11, right panel) in log-scale. The dotted lines represent Keplerian trends for the respectively colour-coded central masses. The vertical, white dashed line represents the position of the ring of compact SiO emission shown in Fig. 13, which is assumed to be the inner rim of the disc. The offset is measured with respect to the stellar position. The contours are drawn at 3, 6, and 24 times the noise rms. At offsets larger than the inner rim position, the 3 × σrms contour lies between the 2 and 4 M⊙ Keplerian trends, following the 3 M⊙ trend quite closely.
Current usage metrics show cumulative count of Article Views (full-text article views including HTML views, PDF and ePub downloads, according to the available data) and Abstracts Views on Vision4Press platform.
Data correspond to usage on the plateform after 2015. The current usage metrics is available 48-96 hours after online publication and is updated daily on week days.
Initial download of the metrics may take a while.