Fig. 12.
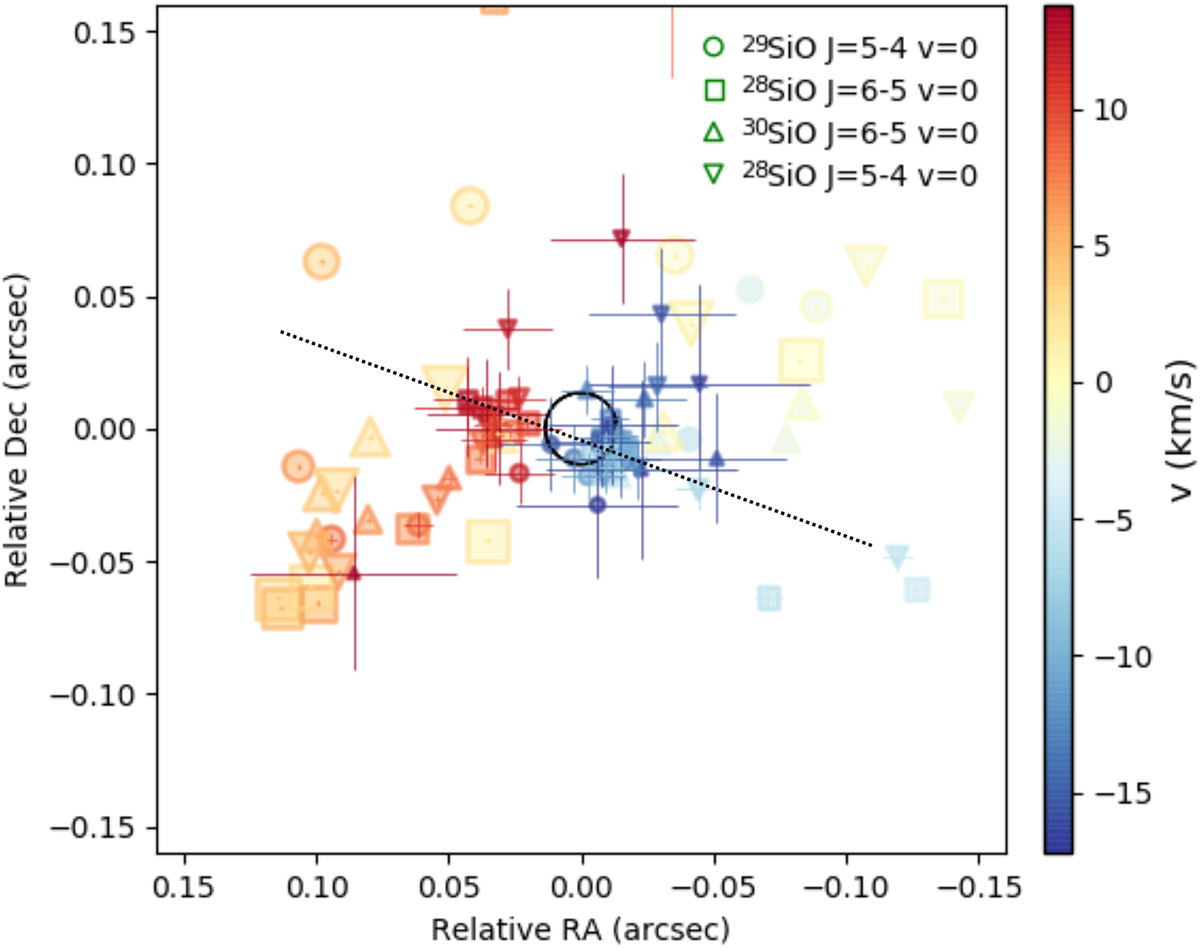
Position and velocity of the peak positions of the Gaussian-fitted components of the 28SiO, 29SiO J = 5−4, and 28SiO, 30SiO J = 6−5 ground-state vibrational emission lines of the mid-configuration dataset. The black circle in the middle represents the size of the stellar photosphere (Sect. 3). The marker size reflects the magnitude of the integrated flux of the Gaussian-fitted component, scaled as log10(integrated flux). The dashed black line indicates the PA = 70° axis.
Current usage metrics show cumulative count of Article Views (full-text article views including HTML views, PDF and ePub downloads, according to the available data) and Abstracts Views on Vision4Press platform.
Data correspond to usage on the plateform after 2015. The current usage metrics is available 48-96 hours after online publication and is updated daily on week days.
Initial download of the metrics may take a while.