Fig. 10.
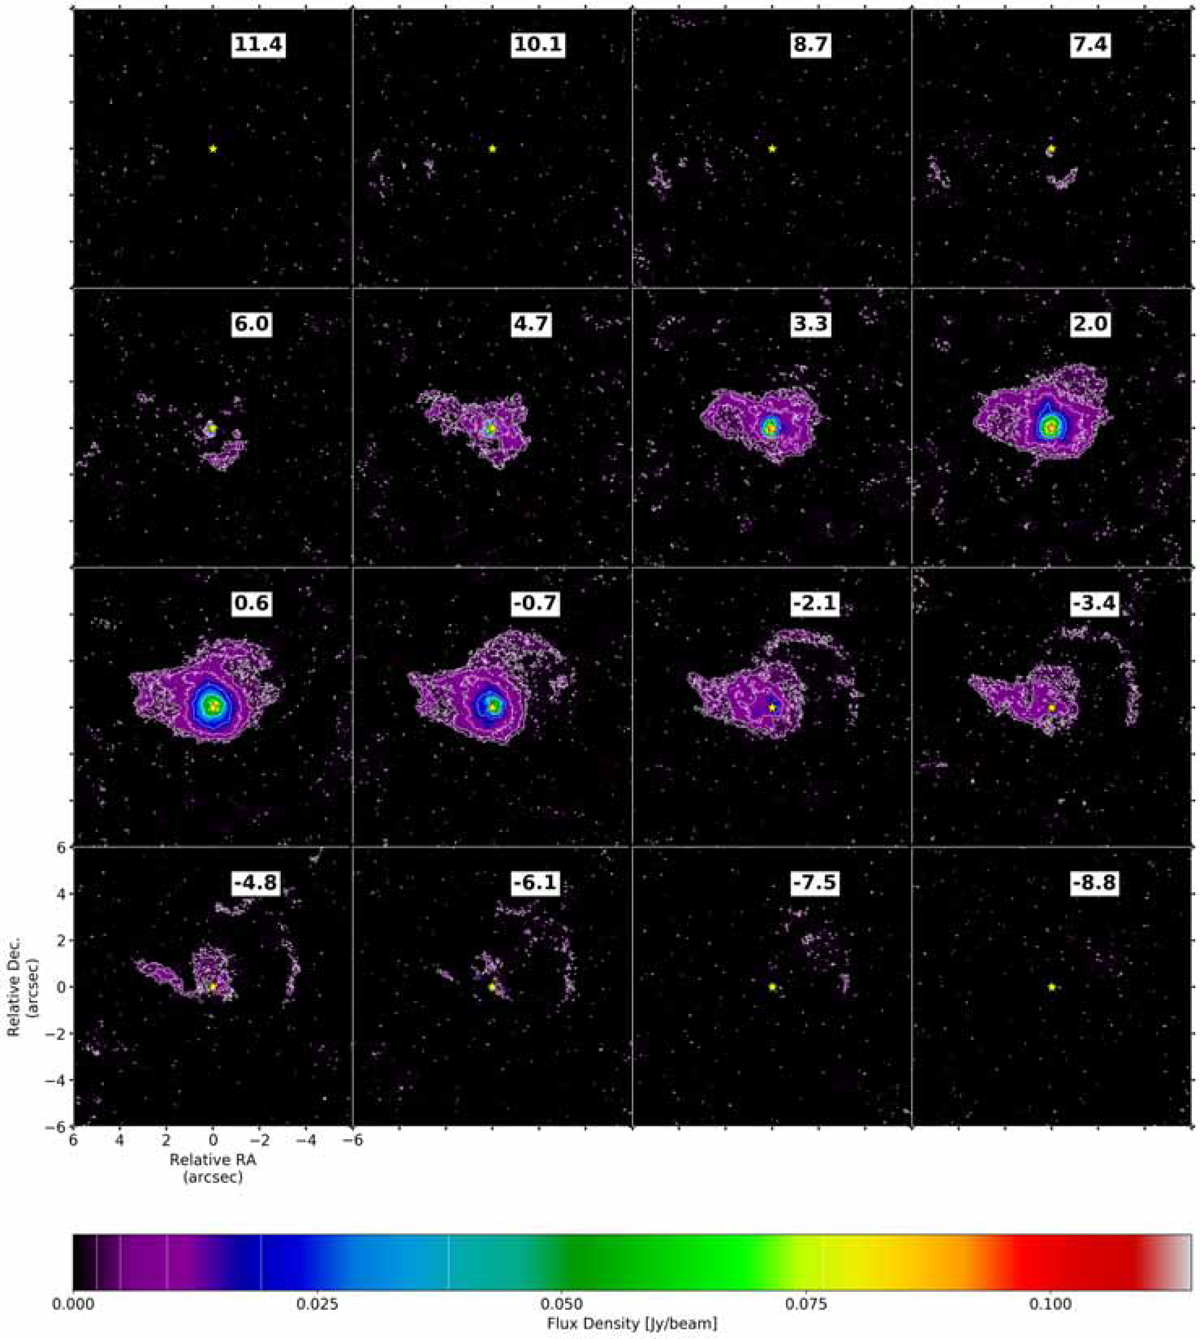
Channel maps showing the spatially resolved emission of the SiO v = 0 J = 5–4 line in the ± ∼ 10 km s−1 velocity range for the combined dataset. The velocities have been corrected for v* = −10.1 km s−1. Contours are drawn at 3, 6, 12, 24, 48, 96, and 192 × σrms (σrms = 0.7 × 10⁻³ Jy beam−1). Angular scales are indicated in the bottom left panel. The ALMA beam has a size (0.088″ × 0.066″). The maps are centred on the continuum peak at position (0, 0), and are indicated by a small yellow star.
Current usage metrics show cumulative count of Article Views (full-text article views including HTML views, PDF and ePub downloads, according to the available data) and Abstracts Views on Vision4Press platform.
Data correspond to usage on the plateform after 2015. The current usage metrics is available 48-96 hours after online publication and is updated daily on week days.
Initial download of the metrics may take a while.