Fig. 1.
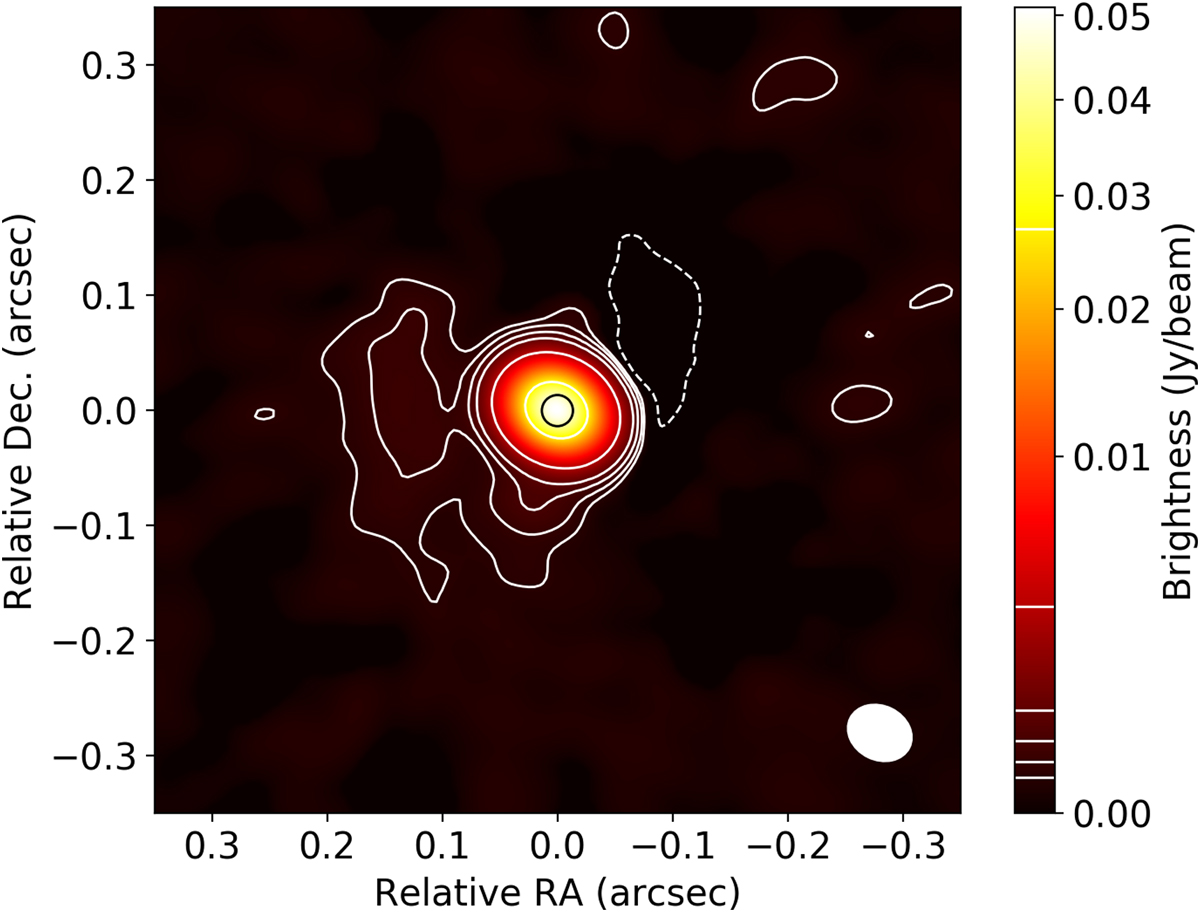
Continuum emission of the combined array data of R Hya, at an effective mean frequency of 250 GHz. Contours are drawn at −3, 3, 6, 12, 24, 96 and 768 times the continuum rms noise value (3.5 × 10⁻⁵ Jy beam−1), negative contours are dashed. The ALMA beam size (0.057″ × 0.047″) is shown in the bottom right corner. The stellar photosphere as determined from the visibility fitting is drawn as a small black circle in the centre.
Current usage metrics show cumulative count of Article Views (full-text article views including HTML views, PDF and ePub downloads, according to the available data) and Abstracts Views on Vision4Press platform.
Data correspond to usage on the plateform after 2015. The current usage metrics is available 48-96 hours after online publication and is updated daily on week days.
Initial download of the metrics may take a while.