Fig. 4.
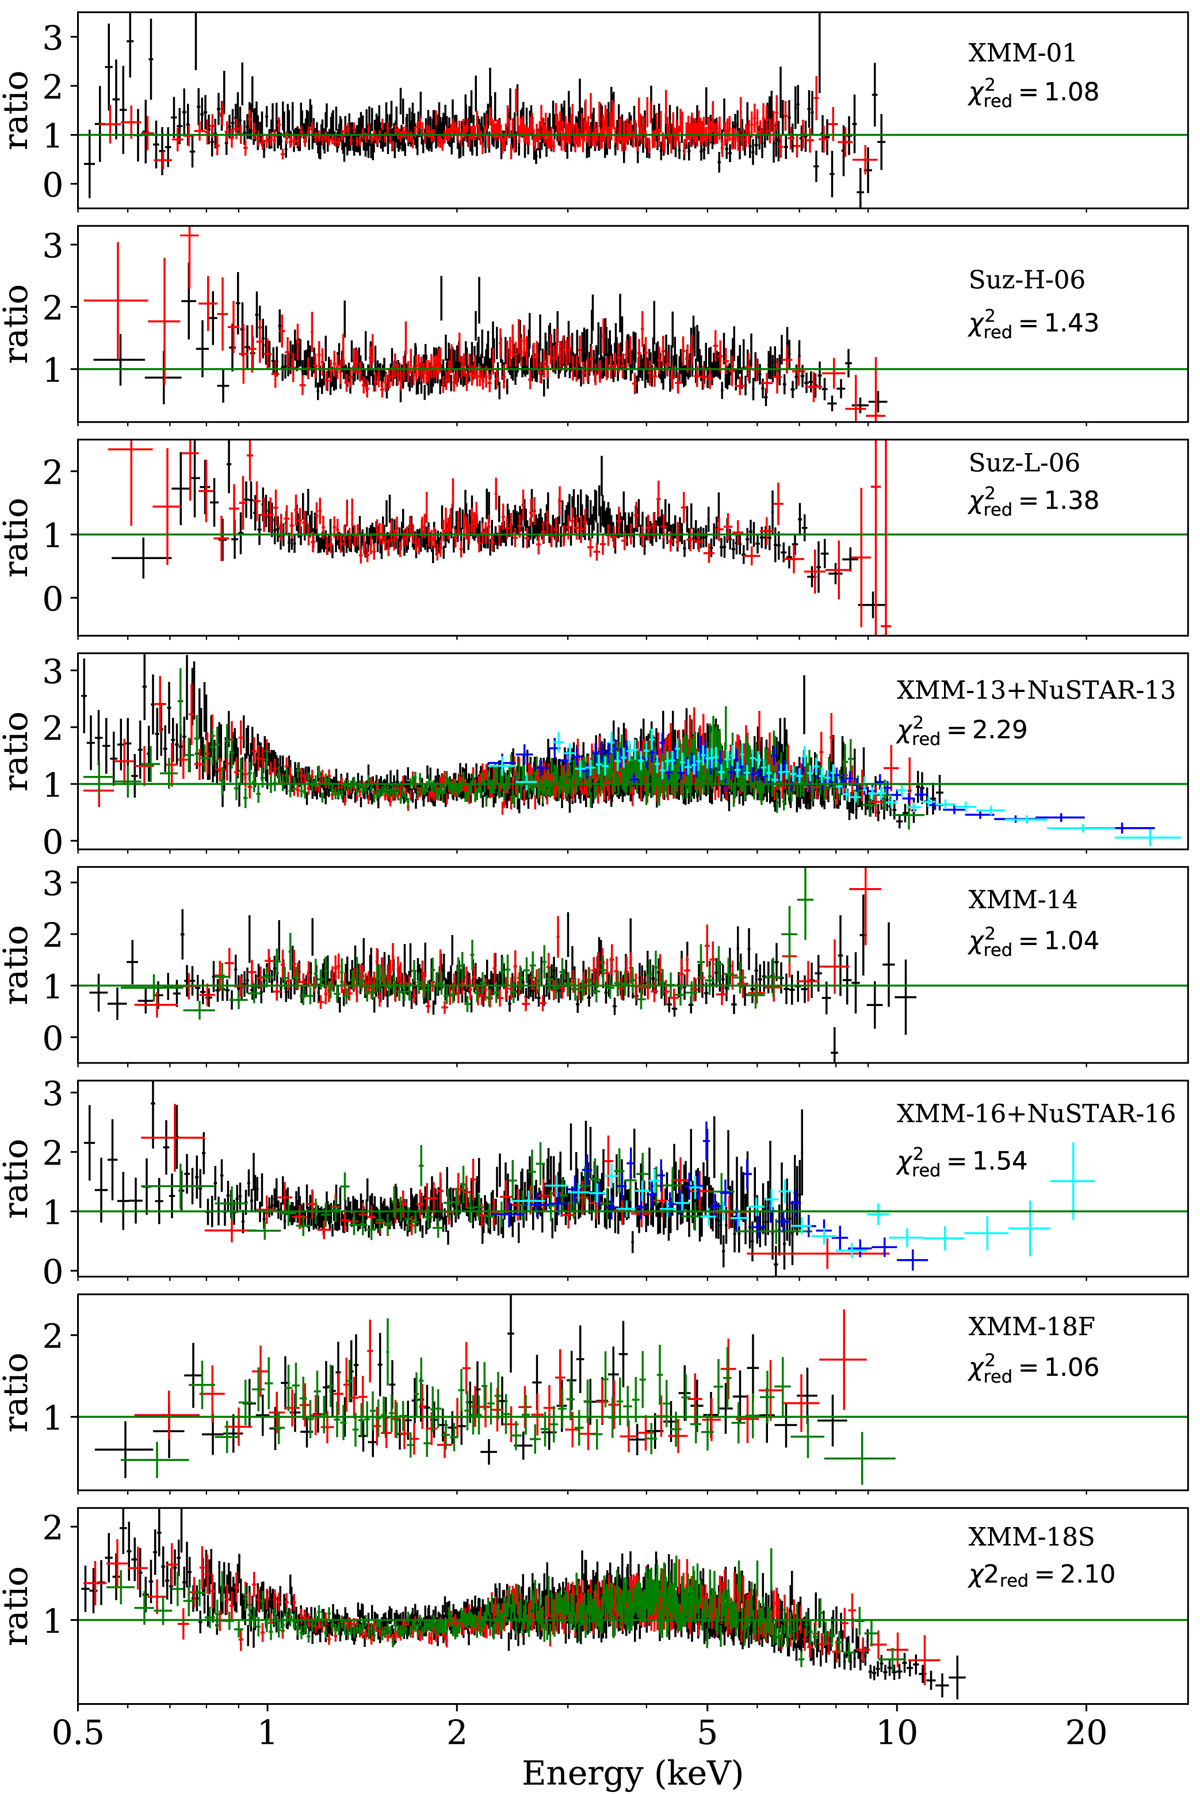
Data-to-model ratio obtained from the fit of the tbabs*pl model to the data from all epochs marked at each panel. In the case of XMM-Newton, black, red, and green data points are from the EPIC-pn, MOS1, and MOS2 detectors, respectively. In the case of the Suzaku data, black points are from the front-illuminated XIS023 chips and red points are from the back-illuminated XIS1 chips. The blue and cyan points are from NuSTAR FPMA and FPMB, respectively.
Current usage metrics show cumulative count of Article Views (full-text article views including HTML views, PDF and ePub downloads, according to the available data) and Abstracts Views on Vision4Press platform.
Data correspond to usage on the plateform after 2015. The current usage metrics is available 48-96 hours after online publication and is updated daily on week days.
Initial download of the metrics may take a while.