Free Access
Fig. B.1.
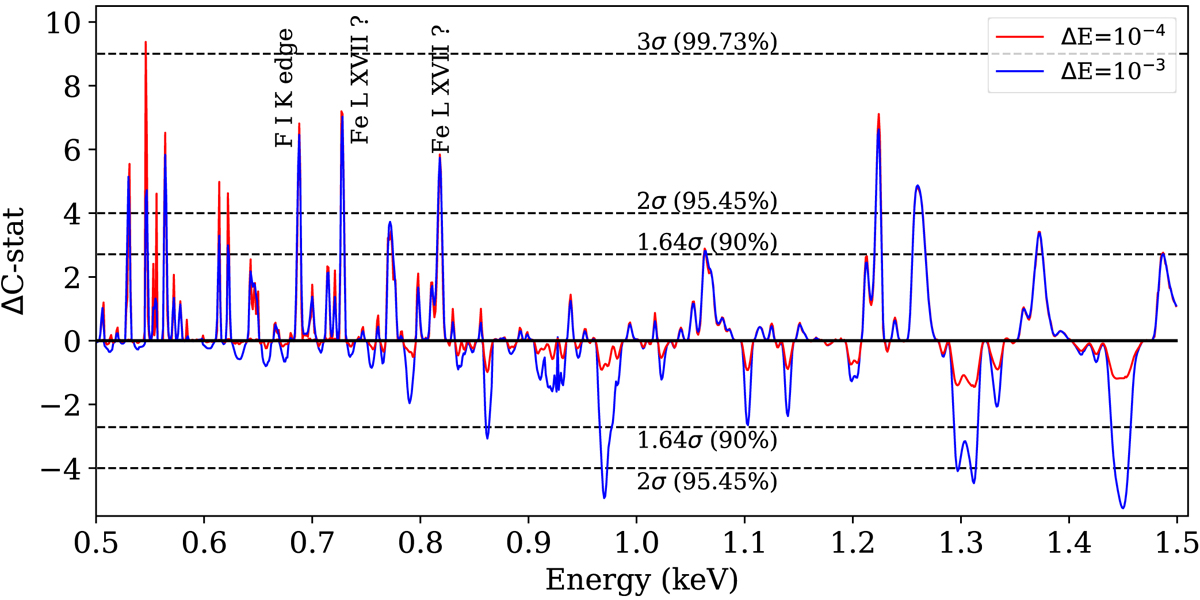
Result of the line search from the first-order RGS data by scanning the spectra using a narrow Gaussian. Positive and negative values of ΔC-stat denote candidate emission and absorption features, respectively. The F I K edge effect is instrumental in nature.
Current usage metrics show cumulative count of Article Views (full-text article views including HTML views, PDF and ePub downloads, according to the available data) and Abstracts Views on Vision4Press platform.
Data correspond to usage on the plateform after 2015. The current usage metrics is available 48-96 hours after online publication and is updated daily on week days.
Initial download of the metrics may take a while.