Fig. 8.
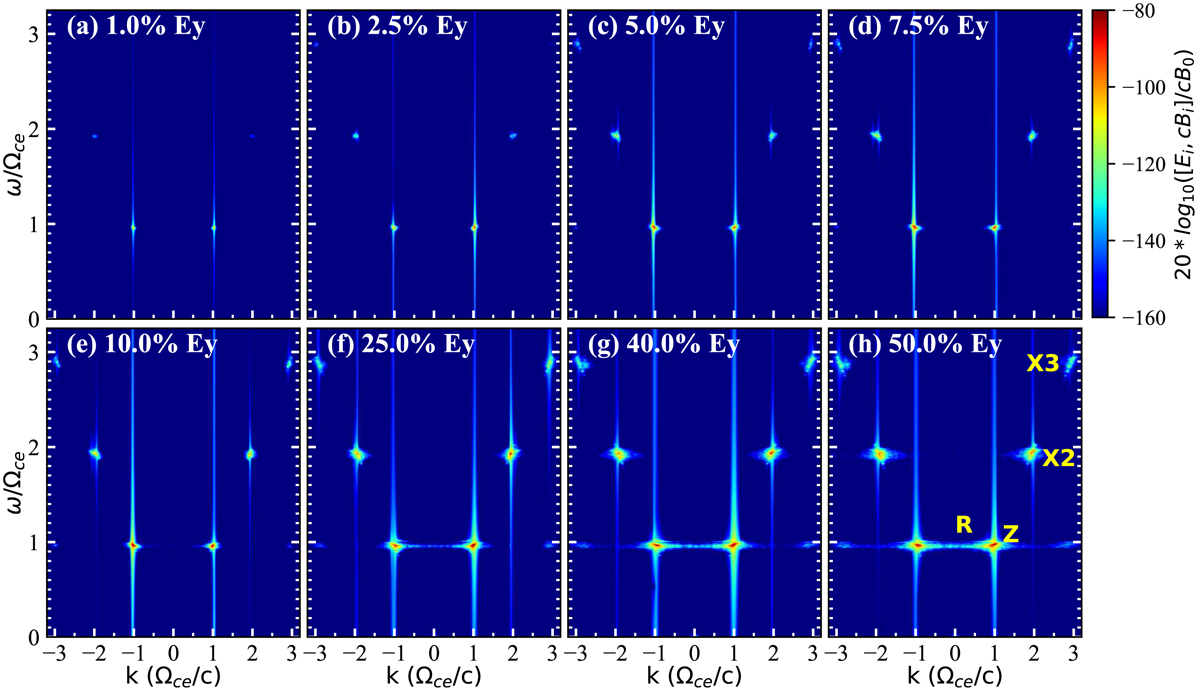
ω-k dispersion diagrams of the pure transverse electric component (Ey) in the perpendicular direction. Each panel represents the result of the simulation with a certain ne/n0. The analyses are performed for the whole stage of each simulation case, which is 0–500 ![]() with ne/n0 = 1% and 2.5%, and 0–300
with ne/n0 = 1% and 2.5%, and 0–300 ![]() for the others. “R” stands for the relativistic mode branch.
for the others. “R” stands for the relativistic mode branch.
Current usage metrics show cumulative count of Article Views (full-text article views including HTML views, PDF and ePub downloads, according to the available data) and Abstracts Views on Vision4Press platform.
Data correspond to usage on the plateform after 2015. The current usage metrics is available 48-96 hours after online publication and is updated daily on week days.
Initial download of the metrics may take a while.