Fig. 6.
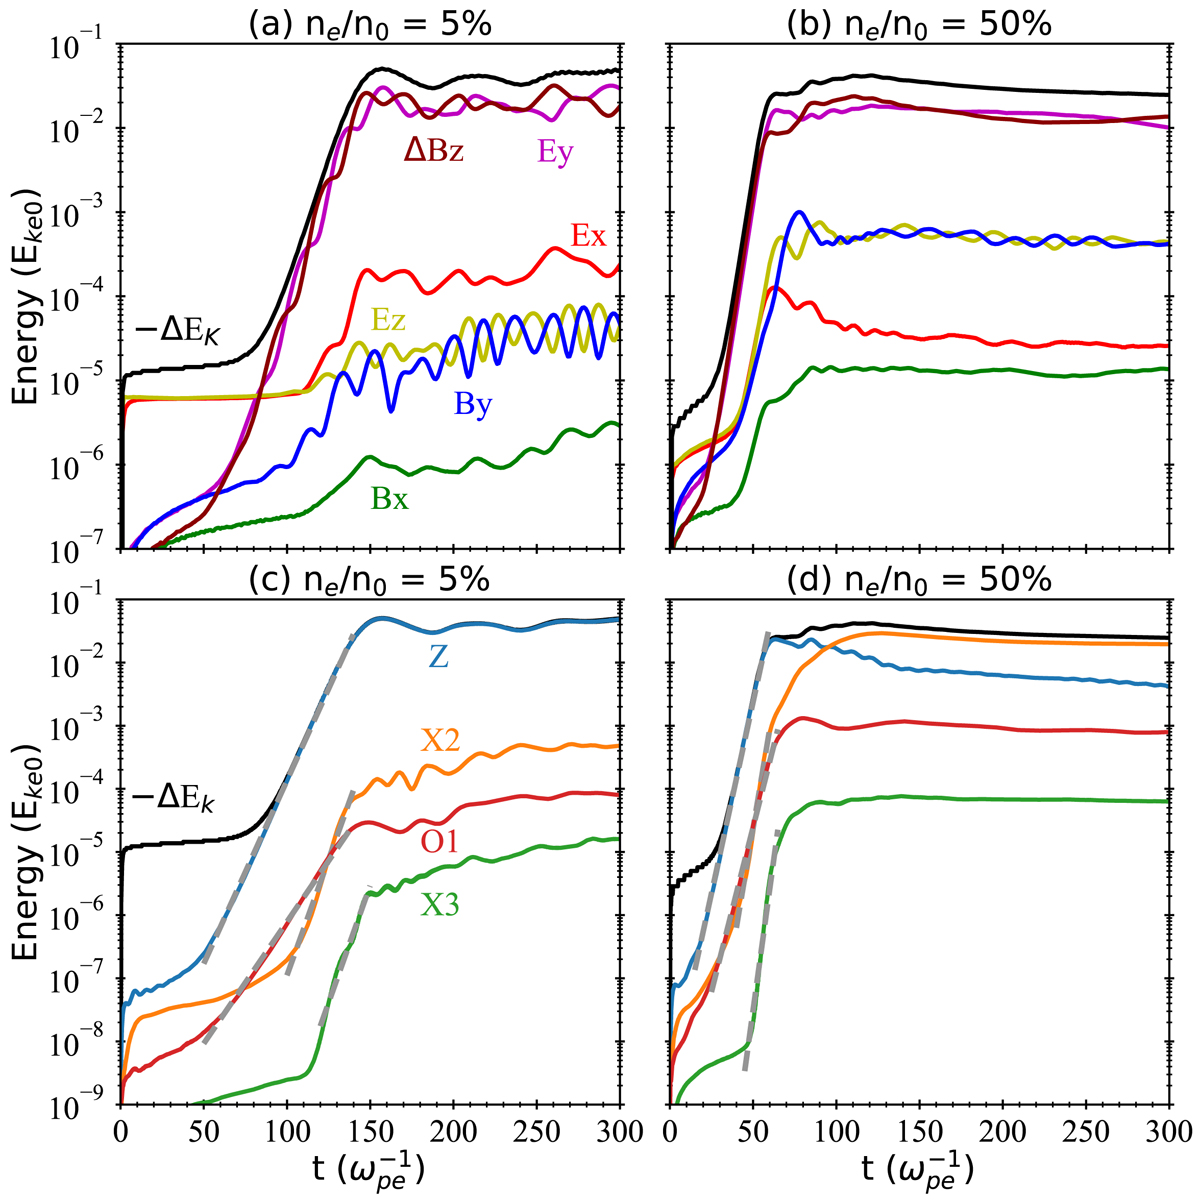
Panels a–b: Temporal profiles of energies of six wave-field components (Ex, Ey, Ez, Bx, By, and ΔBz) with ne/n0 = 5% and 50%. Panels c–b: Temporal energy profiles of the Z, X2, O1, and X3 modes. The energies are normalized to the respective initial kinetic energy of energetic electrons (Eke0). The dark line refers to the relative decline in the kinetic energy of the electrons.
Current usage metrics show cumulative count of Article Views (full-text article views including HTML views, PDF and ePub downloads, according to the available data) and Abstracts Views on Vision4Press platform.
Data correspond to usage on the plateform after 2015. The current usage metrics is available 48-96 hours after online publication and is updated daily on week days.
Initial download of the metrics may take a while.