Fig. 4.
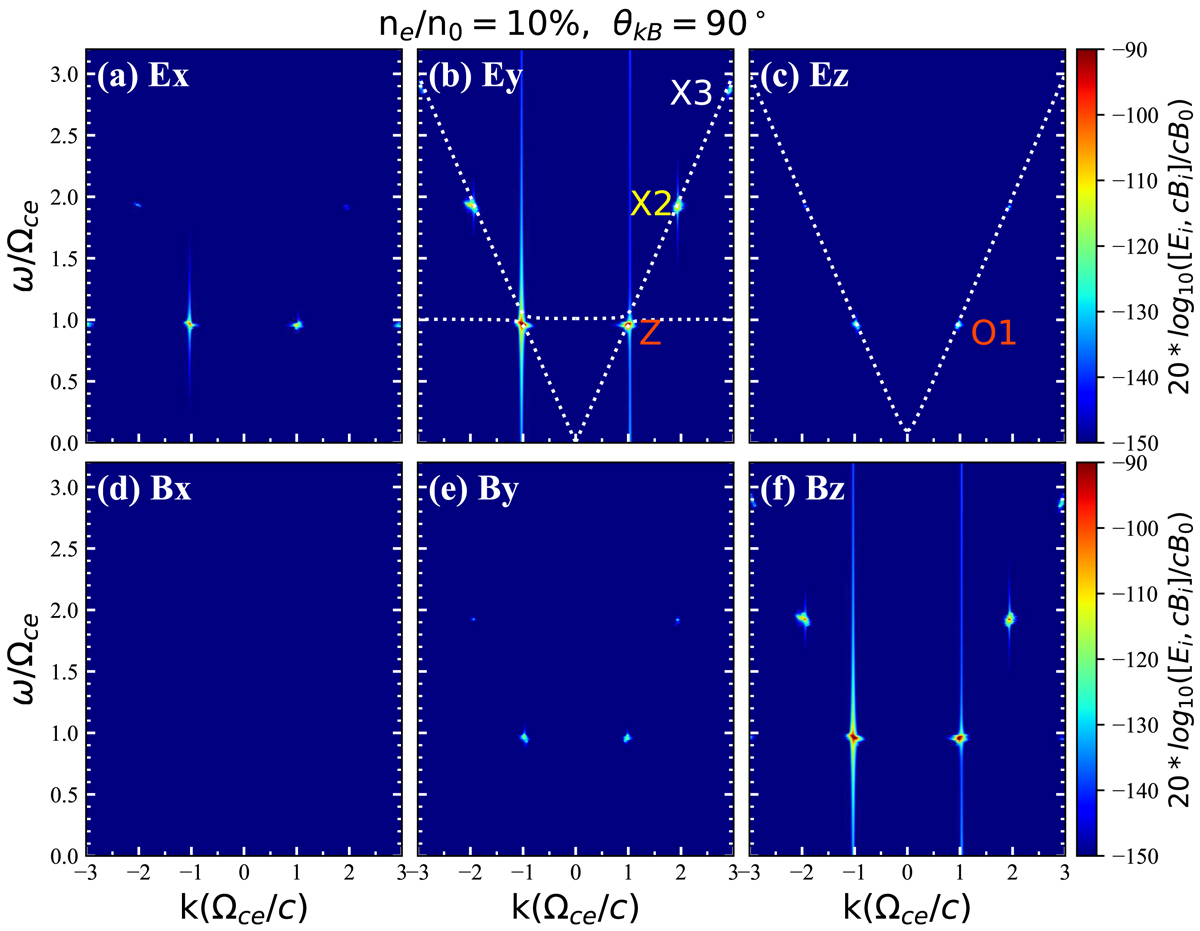
Wave dispersion diagrams of the electric and magnetic components with ne/n0 = 10%, over times 0–300 ![]() in the direction of 90°. Analytical dispersion relations of the X/Z mode and O mode are overplotted as dotted white lines in panels b and c, respectively. Amplified wave modes are marked. An animation of this figure is available online. The video begins at θkB = 70° and advances 1° at a time until it ends at θkB = 110°.
in the direction of 90°. Analytical dispersion relations of the X/Z mode and O mode are overplotted as dotted white lines in panels b and c, respectively. Amplified wave modes are marked. An animation of this figure is available online. The video begins at θkB = 70° and advances 1° at a time until it ends at θkB = 110°.
Current usage metrics show cumulative count of Article Views (full-text article views including HTML views, PDF and ePub downloads, according to the available data) and Abstracts Views on Vision4Press platform.
Data correspond to usage on the plateform after 2015. The current usage metrics is available 48-96 hours after online publication and is updated daily on week days.
Initial download of the metrics may take a while.