Fig. 3.
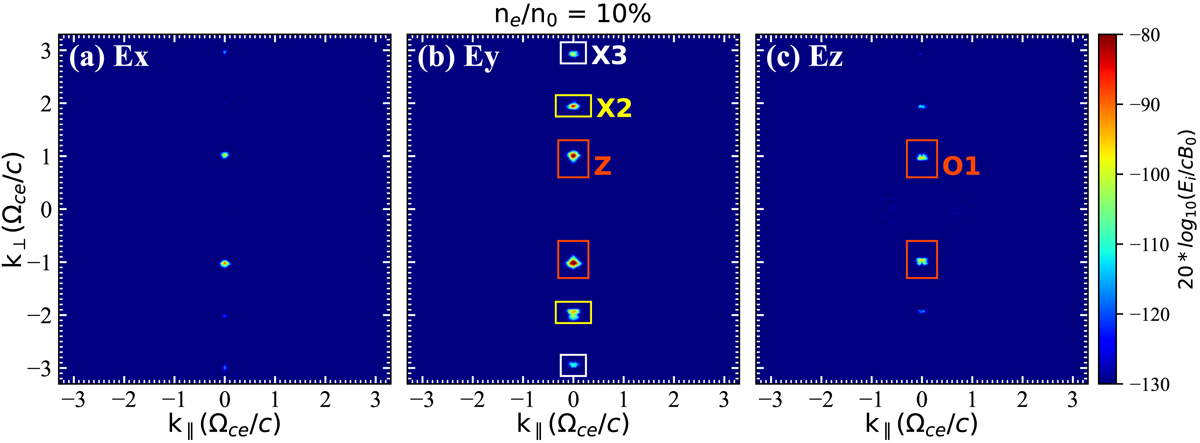
Maximum intensity of (panel a) Ex, (panel b) Ey, and (panel c) Ez in the ω domain in the k∥–k⊥ space as shown by the color map of 20log10[(Ex, Ey, Ez)/(cB0)] over the whole simulation (0–300 ![]() ) for ne/n0 = 10%. “Z”, “X2”, “X3”, and “O1” stand for the Z mode, second-harmonic X mode, third-harmonic X mode, and fundamental O mode, respectively. Rectangles in panel (b) represent the areas used to calculate energies of the respective wave modes. See Fig. 2b for the obtained energy profiles.
) for ne/n0 = 10%. “Z”, “X2”, “X3”, and “O1” stand for the Z mode, second-harmonic X mode, third-harmonic X mode, and fundamental O mode, respectively. Rectangles in panel (b) represent the areas used to calculate energies of the respective wave modes. See Fig. 2b for the obtained energy profiles.
Current usage metrics show cumulative count of Article Views (full-text article views including HTML views, PDF and ePub downloads, according to the available data) and Abstracts Views on Vision4Press platform.
Data correspond to usage on the plateform after 2015. The current usage metrics is available 48-96 hours after online publication and is updated daily on week days.
Initial download of the metrics may take a while.