Fig. 1.
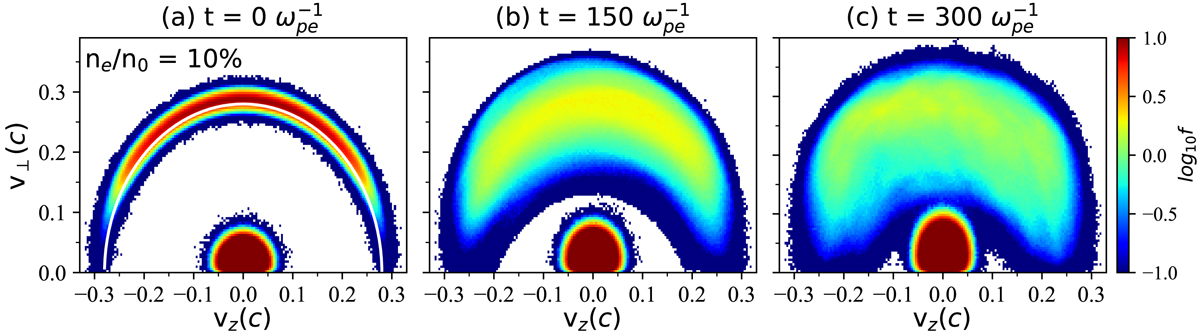
Snapshots of the velocity distribution of the simulations with ne/n0 = 10%. The distributions are obtained at t = 0 ![]() (panel a), 150
(panel a), 150 ![]() (panel b), and 300
(panel b), and 300 ![]() (panel c). The white curve in panel a is the resonant curve of the Z, X2, and X3 modes amplified at 90°, with ω = 0.96 Ωce (n = 1), ω = 1.92 Ωce (n = 2), and ω = 2.88 Ωce (n = 3). An animation of this figure is available online starting at t = 0
(panel c). The white curve in panel a is the resonant curve of the Z, X2, and X3 modes amplified at 90°, with ω = 0.96 Ωce (n = 1), ω = 1.92 Ωce (n = 2), and ω = 2.88 Ωce (n = 3). An animation of this figure is available online starting at t = 0 ![]() and ending at 300
and ending at 300 ![]() .
.
Current usage metrics show cumulative count of Article Views (full-text article views including HTML views, PDF and ePub downloads, according to the available data) and Abstracts Views on Vision4Press platform.
Data correspond to usage on the plateform after 2015. The current usage metrics is available 48-96 hours after online publication and is updated daily on week days.
Initial download of the metrics may take a while.