Free Access
Fig. 7.
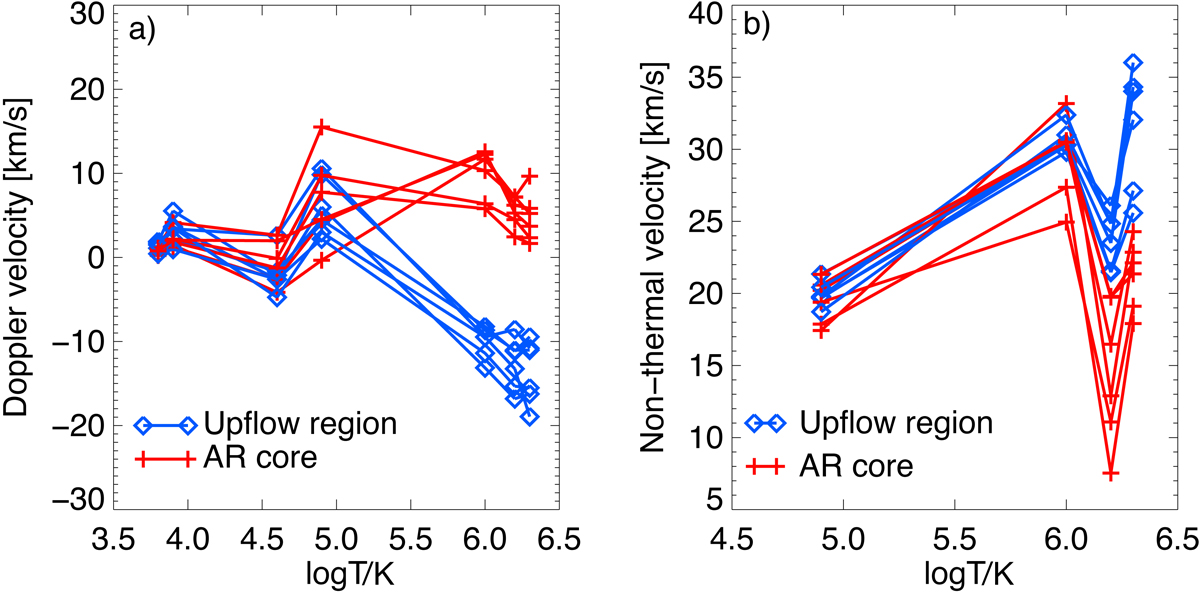
Average Doppler velocities (panel a) and non-thermal velocities (panel b) ordered with the growing line formation temperatures. The panels shows velocities calculated in the upflow region (line blue) and the active region core (red line) for six observations.
Current usage metrics show cumulative count of Article Views (full-text article views including HTML views, PDF and ePub downloads, according to the available data) and Abstracts Views on Vision4Press platform.
Data correspond to usage on the plateform after 2015. The current usage metrics is available 48-96 hours after online publication and is updated daily on week days.
Initial download of the metrics may take a while.