Fig. 6.
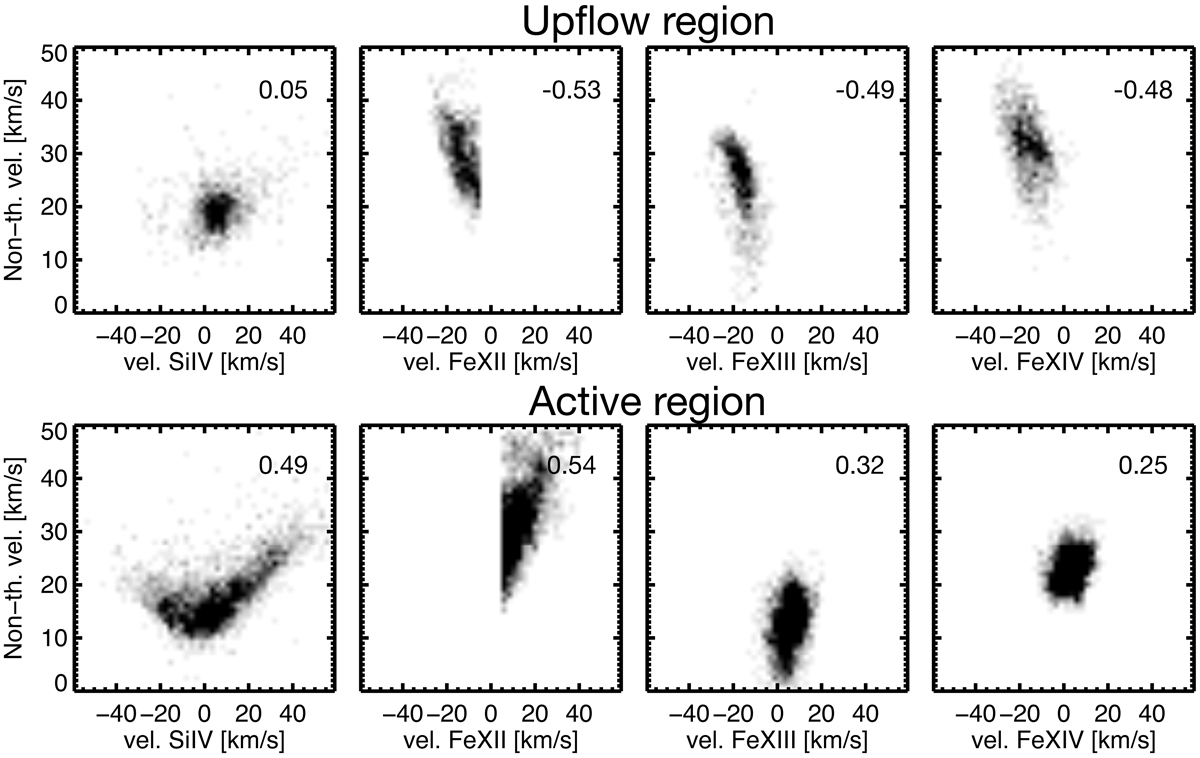
Probability density functions for the non-thermal velocity and Doppler velocity relation for the upflow region (top panels) and the active region core (bottom panels) for the observation from 15 November 2017. For the upflow region panels (top row), the number in the right corner shows the linear correlation coefficient. For the active region core panels (bottom row), the number in the right corner represents a non-linear Spearman’s rank correlation. The panel of the Si IV line in the active region core shows a dichotomy. Thus, we additionally calculated the non-linear correlation coefficient separately for the negative, positive, and absolute Doppler velocity and obtained −0.39, 0.74, and 0.62, respectively.
Current usage metrics show cumulative count of Article Views (full-text article views including HTML views, PDF and ePub downloads, according to the available data) and Abstracts Views on Vision4Press platform.
Data correspond to usage on the plateform after 2015. The current usage metrics is available 48-96 hours after online publication and is updated daily on week days.
Initial download of the metrics may take a while.